COMPEX#
Clouds over cOMPlEX environment COMPEX (blog, wiki) - Polar 5 campaign out of Longyearbyen (13.3.-15.4.2026).
Detailed flight logs#
RF# |
Date |
Description |
TO |
TD |
HH |
Track (png) |
Track (KML) |
|---|---|---|---|---|---|---|---|
RF01 |
15.03.2026 |
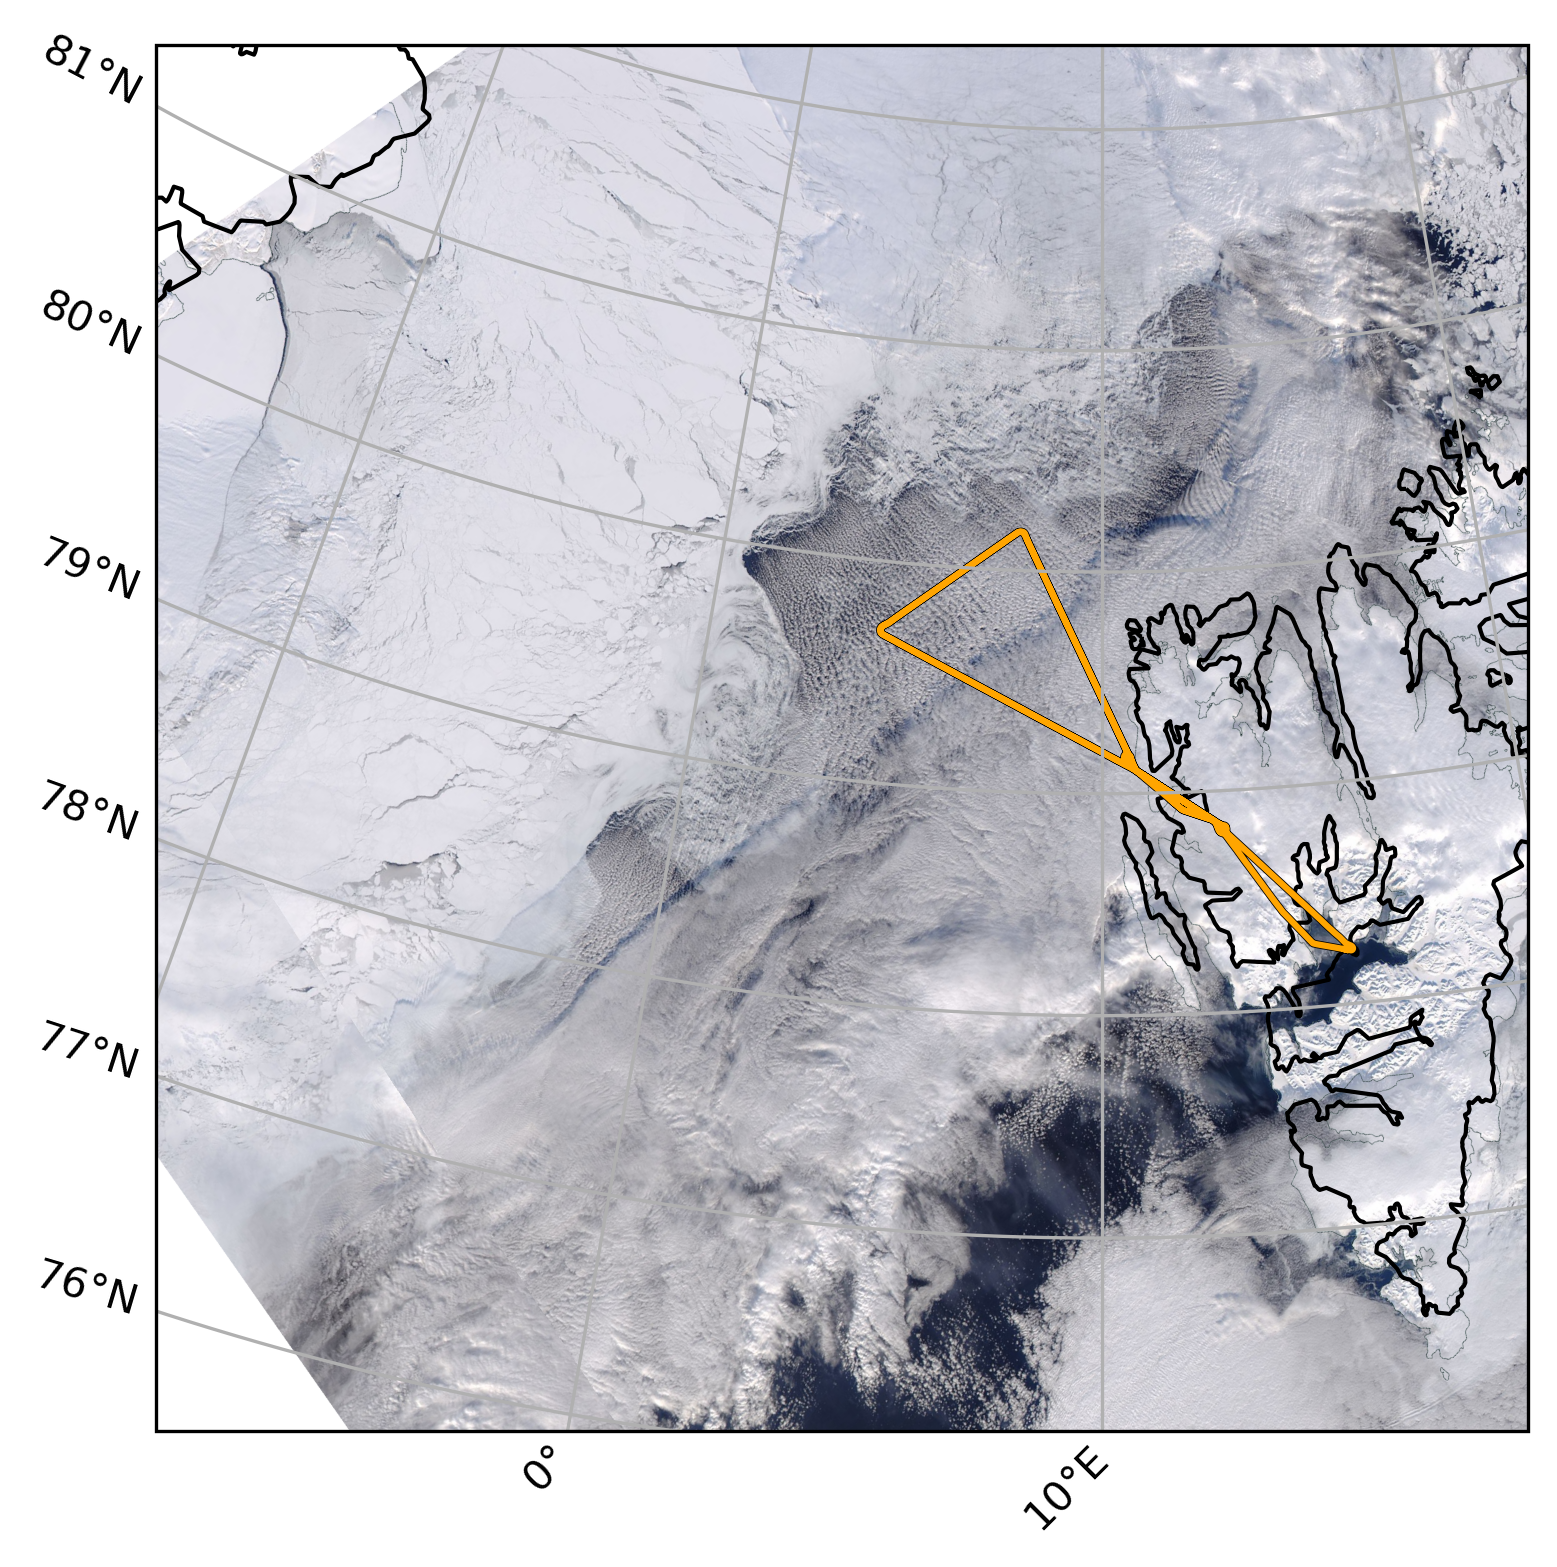
Investigate advected clouds over sea ice west of Svalbard. |
10:10 |
14:00 |
03:50 |
||
RF02 |
16.03.2026 |
Clouds over sea ice and ocean (south east of Svalbard) #1 |
9:17 |
13:33 |
04:16 |
||
RF03 |
17.03.2026 |
Statistics of clouds over sea ice. |
9:28 |
14:06 |
04:38 |
||
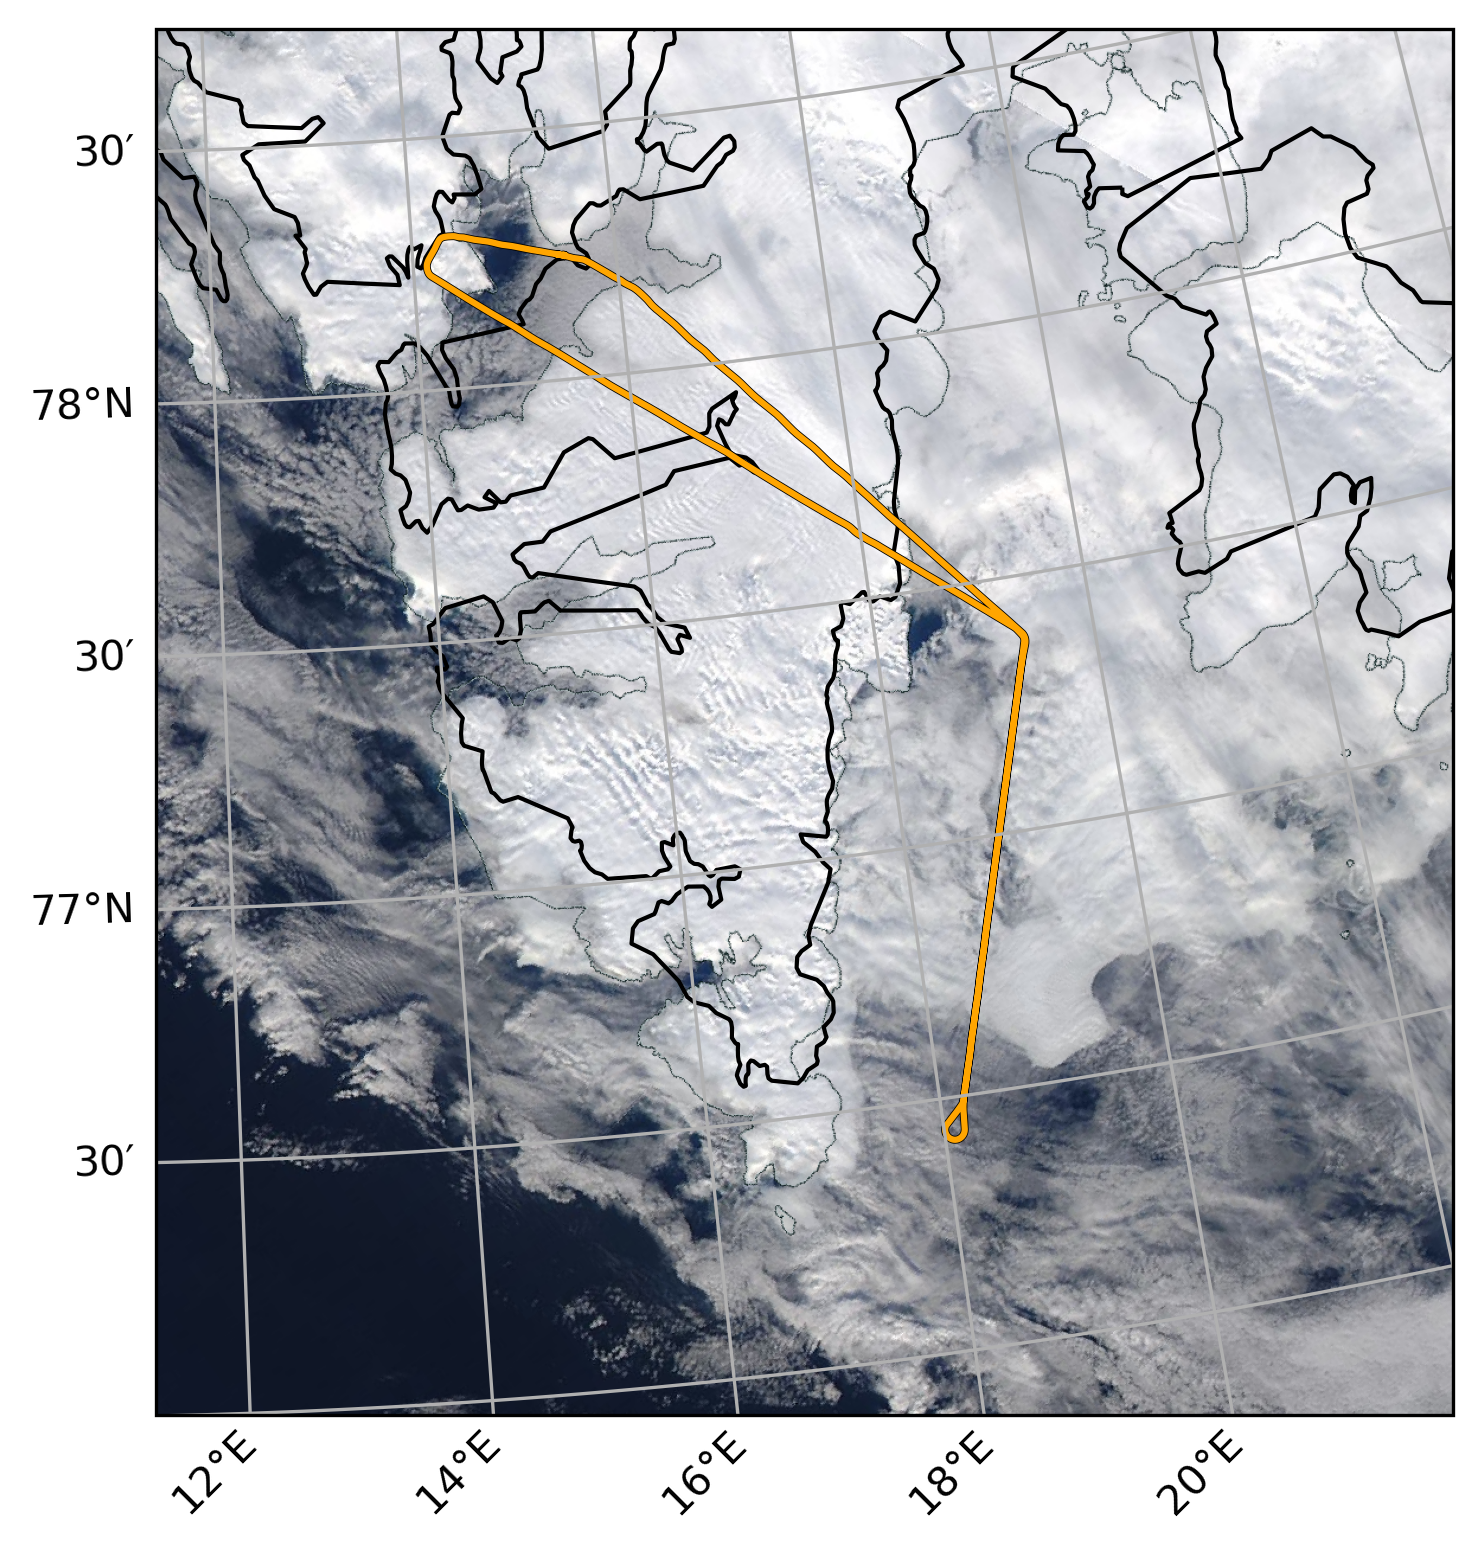
RF04 |
19.03.2026 |
Kongsfjorden survey to investigate sublimation processes. |
9:54 |
14:41 |
04:47 |
||
RF05 |
24.03.2026 |
Investigate the place of origin of an cold air outbreak |
9:55 |
14:14 |
04:16 |
||
RF06 |
25.03.2026 |
Ny-Alesund overflight, MPCs northwest of Svalbard and EarthCARE overpass |
12:17 |
16:55 |
04:48 |
||
RF07 |
26.03.2026 |
Capture developing cloud streets during CAOs using quasi-lagrangian approach |
09:58 |
13:47 |
03:49 |
||
RF08 |
27.03.2026 |
Radiation square, CAOs and EarthCARE overpass |
12:03 |
16:13 |
04:10 |
||
RF09 |
30.03.2026 |
Lagrangian sampling of WAI clouds (for Manfred) |
10:54 |
14:35 |
03:41 |
||
RF10 |
31.03.2026 |
Spatial variability of clouds over Kongsfjorden, convergence line NW of Svalbard |
08:00 |
13:02 |
05:02 |
||
RF11 |
02.04.2026 |
Lead experiment to measure profiles up- and downstream of lead #1 |
07:52 |
11:45 |
03:53 |
||
RF12 |
04.04.2026 |
Investigate the place of origin of an cold air outbreak along marginal sea ice zone |
07:47 |
12:20 |
04:33 |
||
RF13 |
11.04.2026 |
Spatial and temporal variability of clouds over Kongsfjorden with approaching front |
06:52 |
09:36 |
02:44 |
||
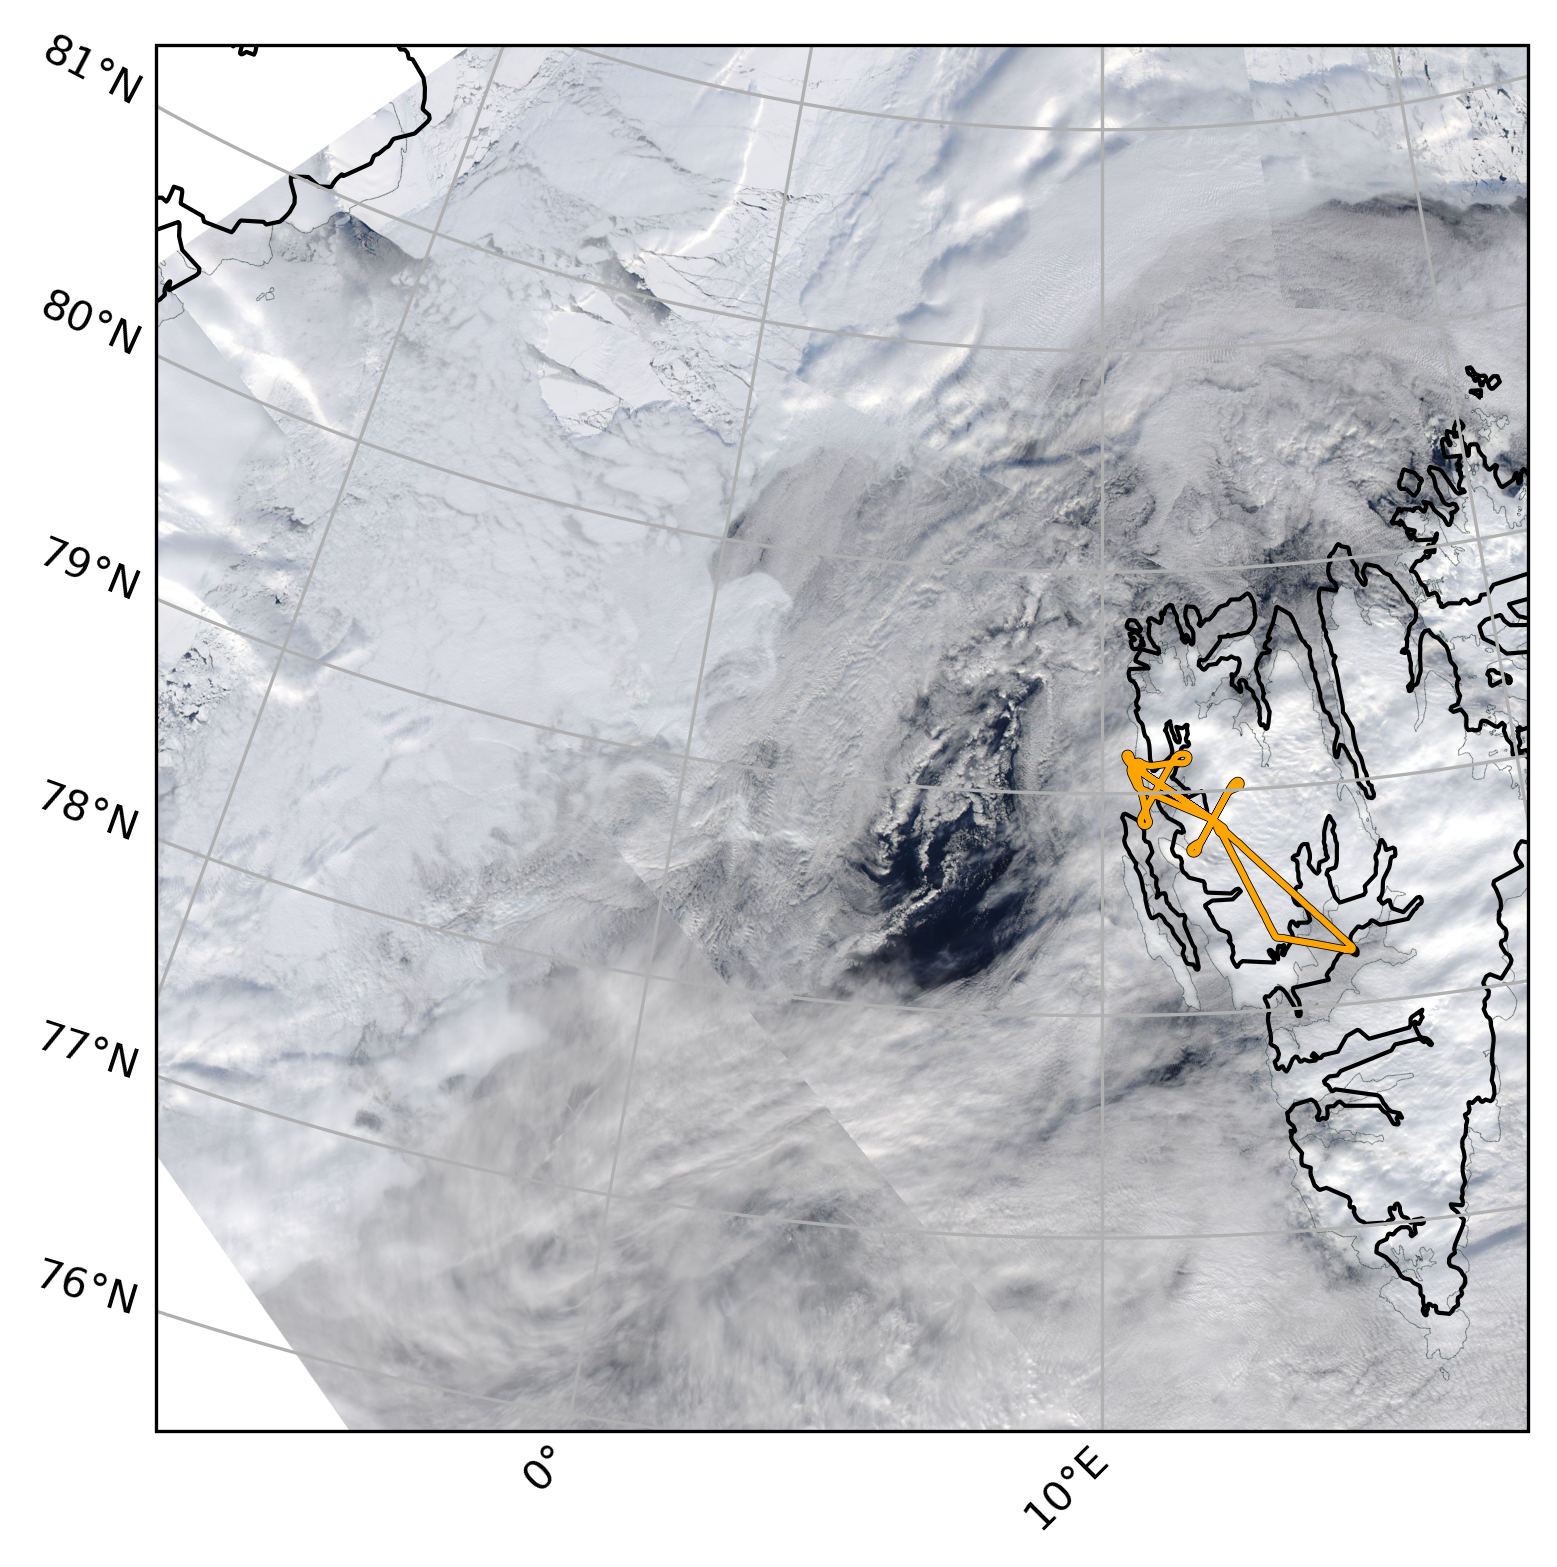
RF14 |
13.04.2026 |
Lead experiment to measure profiles up- and downstream of lead #2 |
07:50 |
12:03 |
04:13 |
||
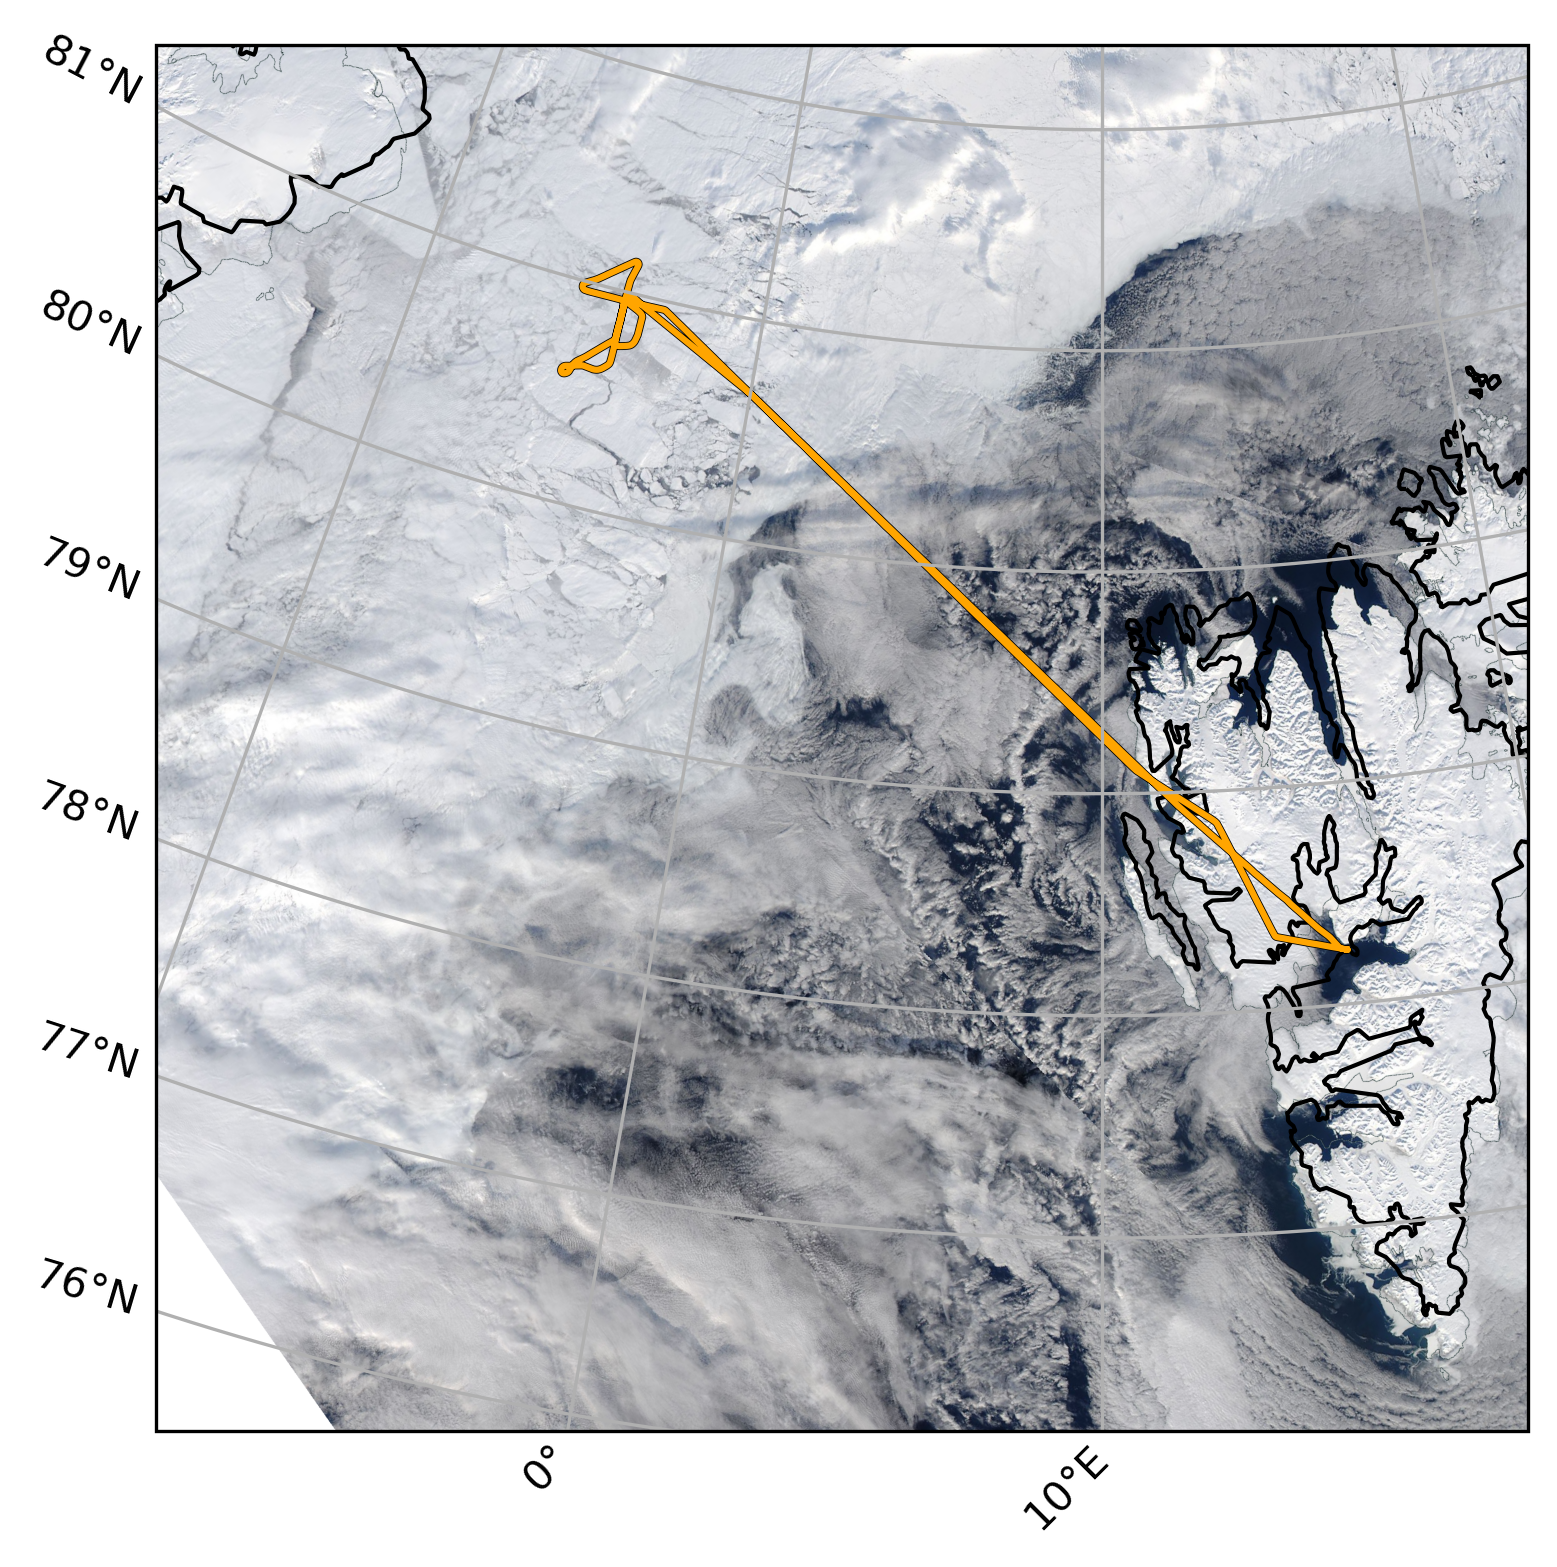
RF15 |
14.04.2026 |
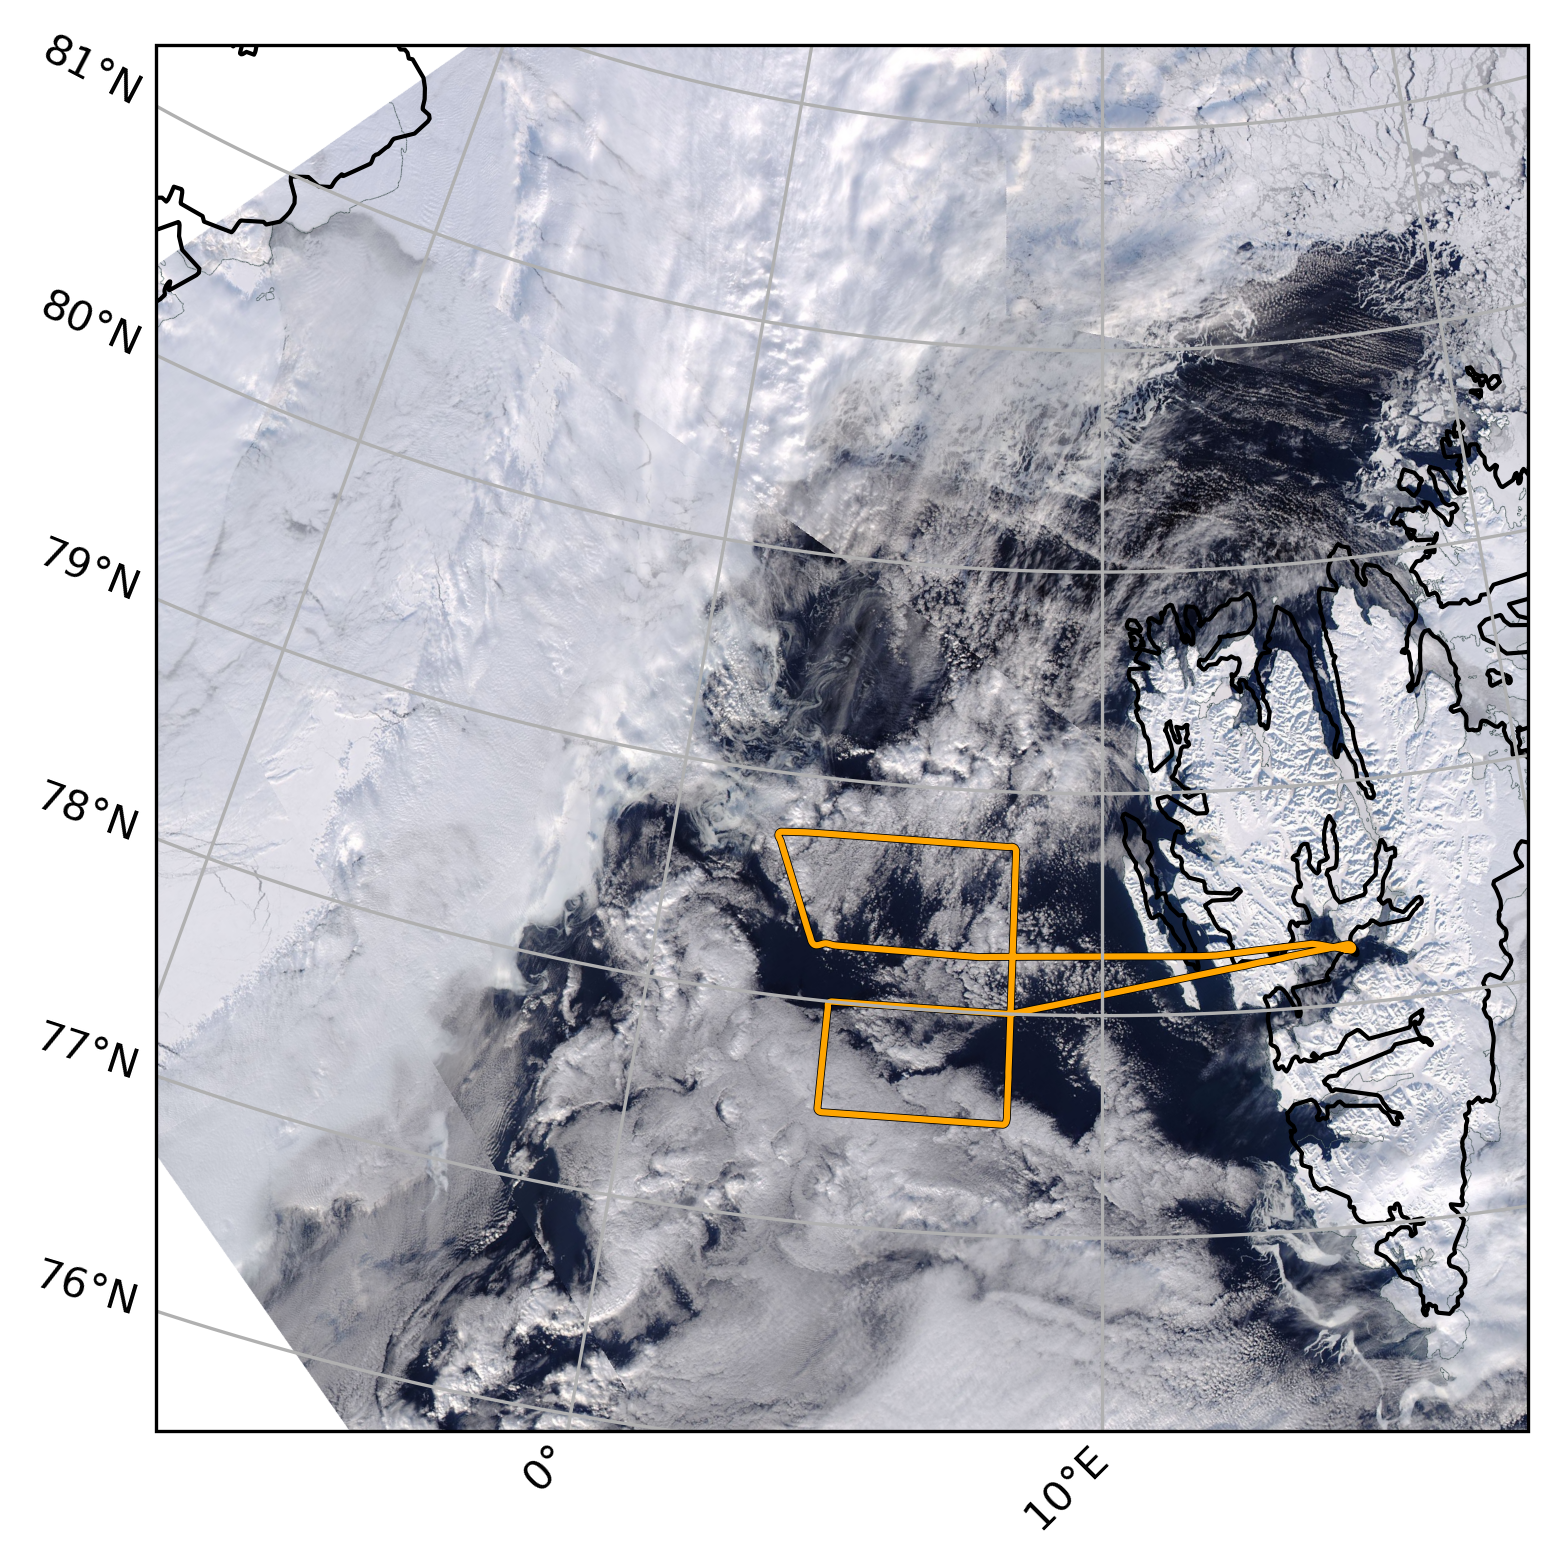
Clouds over sea ice and ocean (south east of Svalbard) #2 |
07:30 |
09:33 |
02:03 |
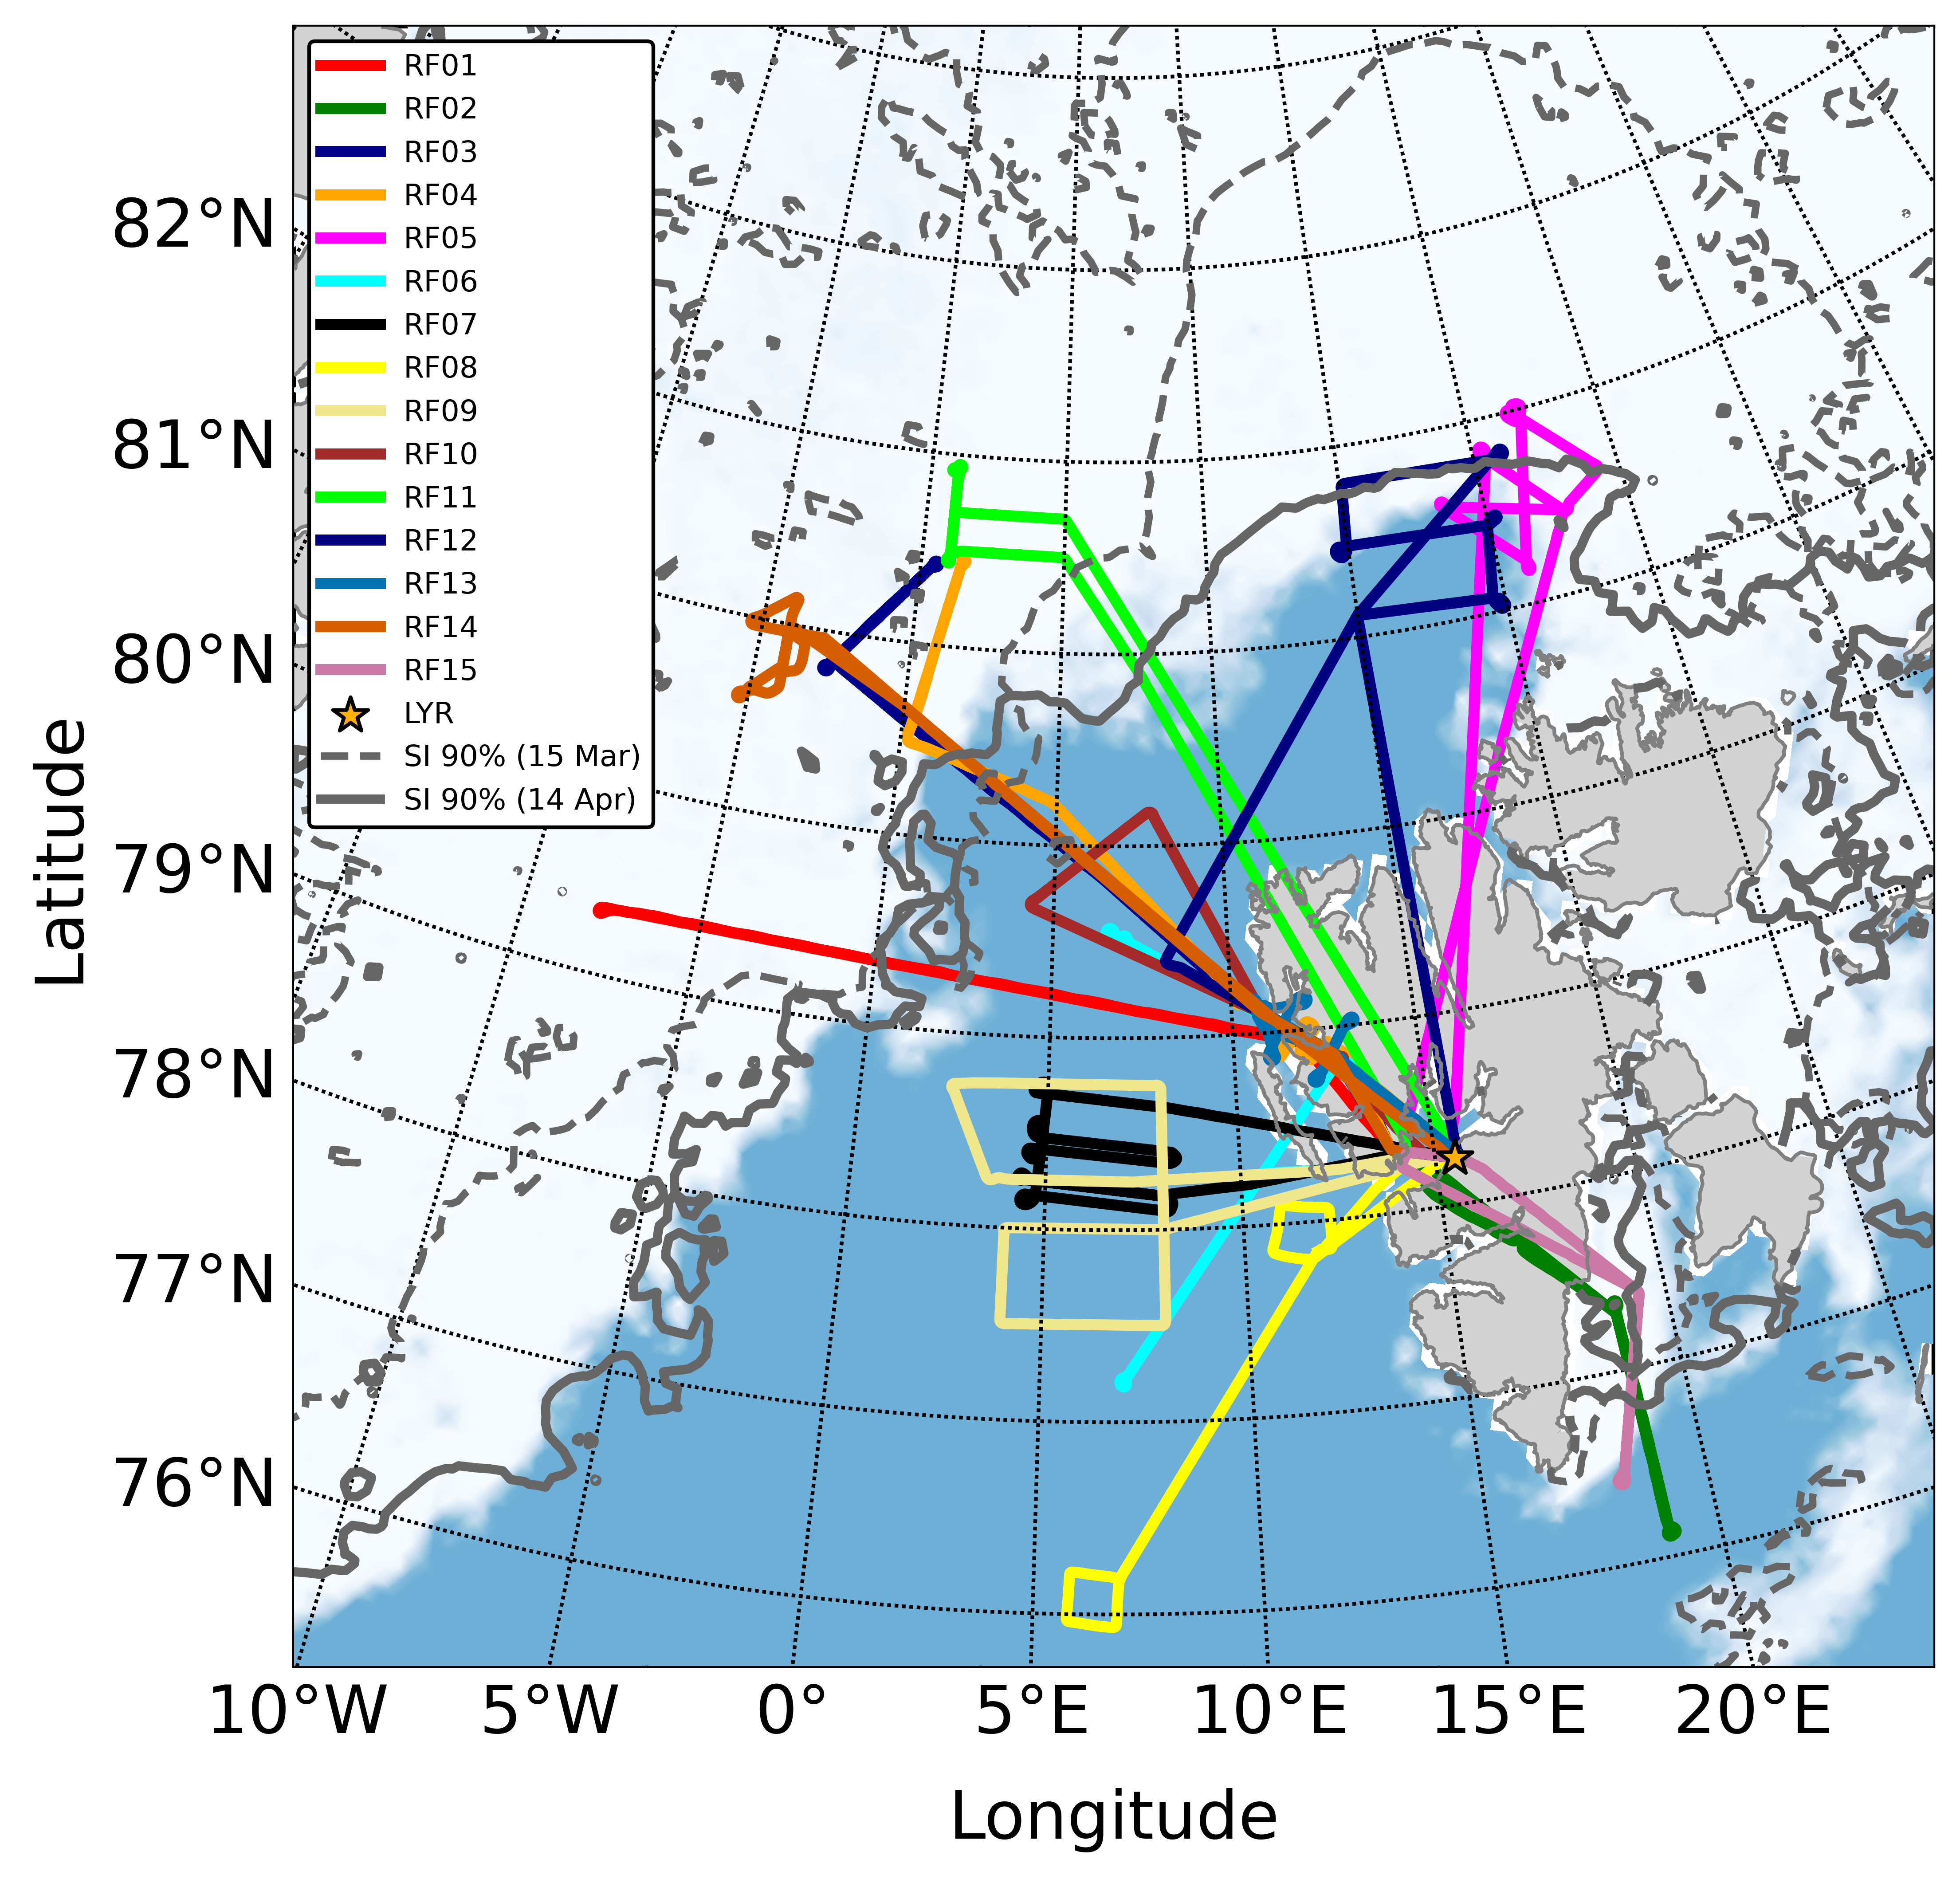
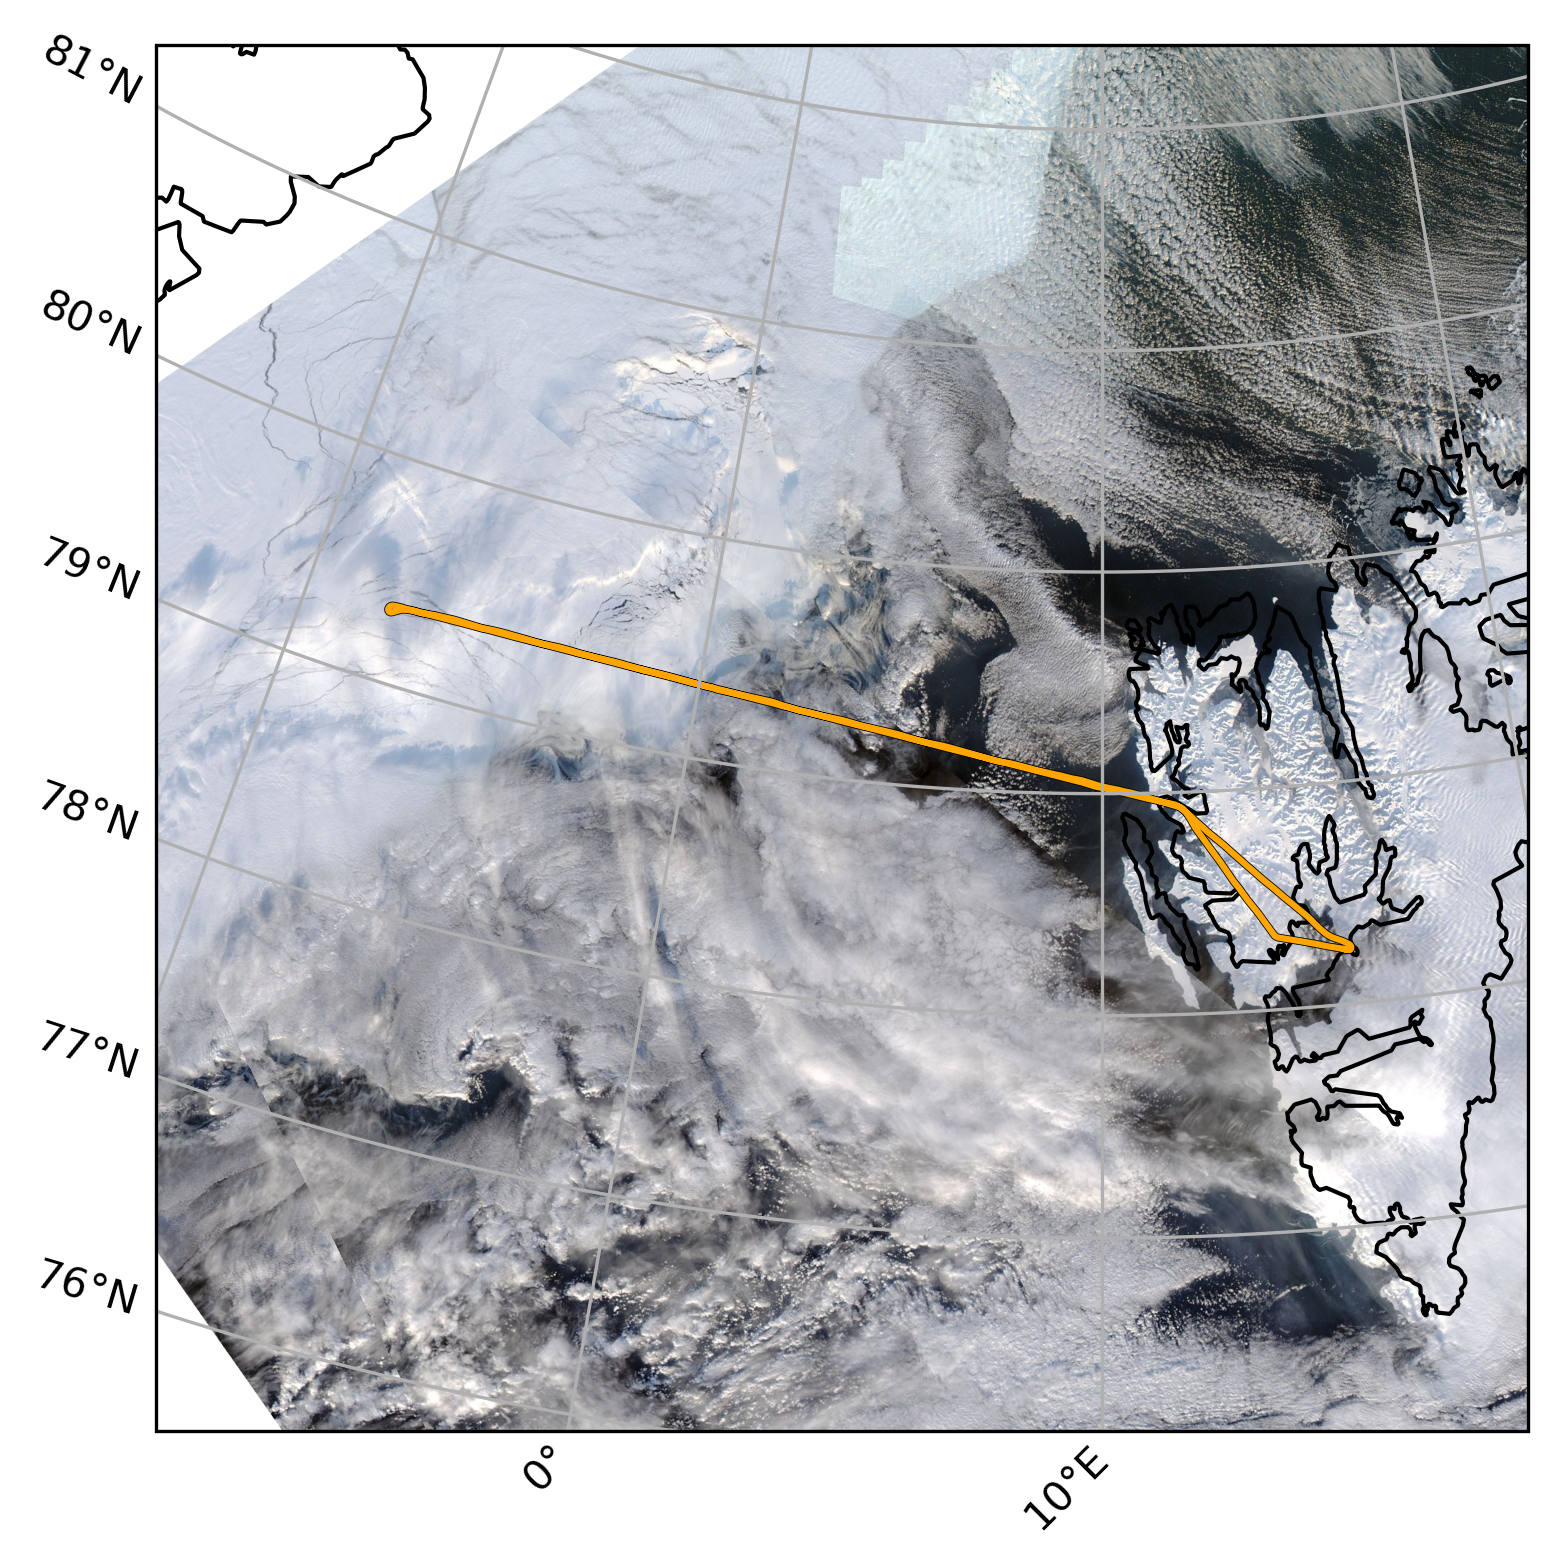
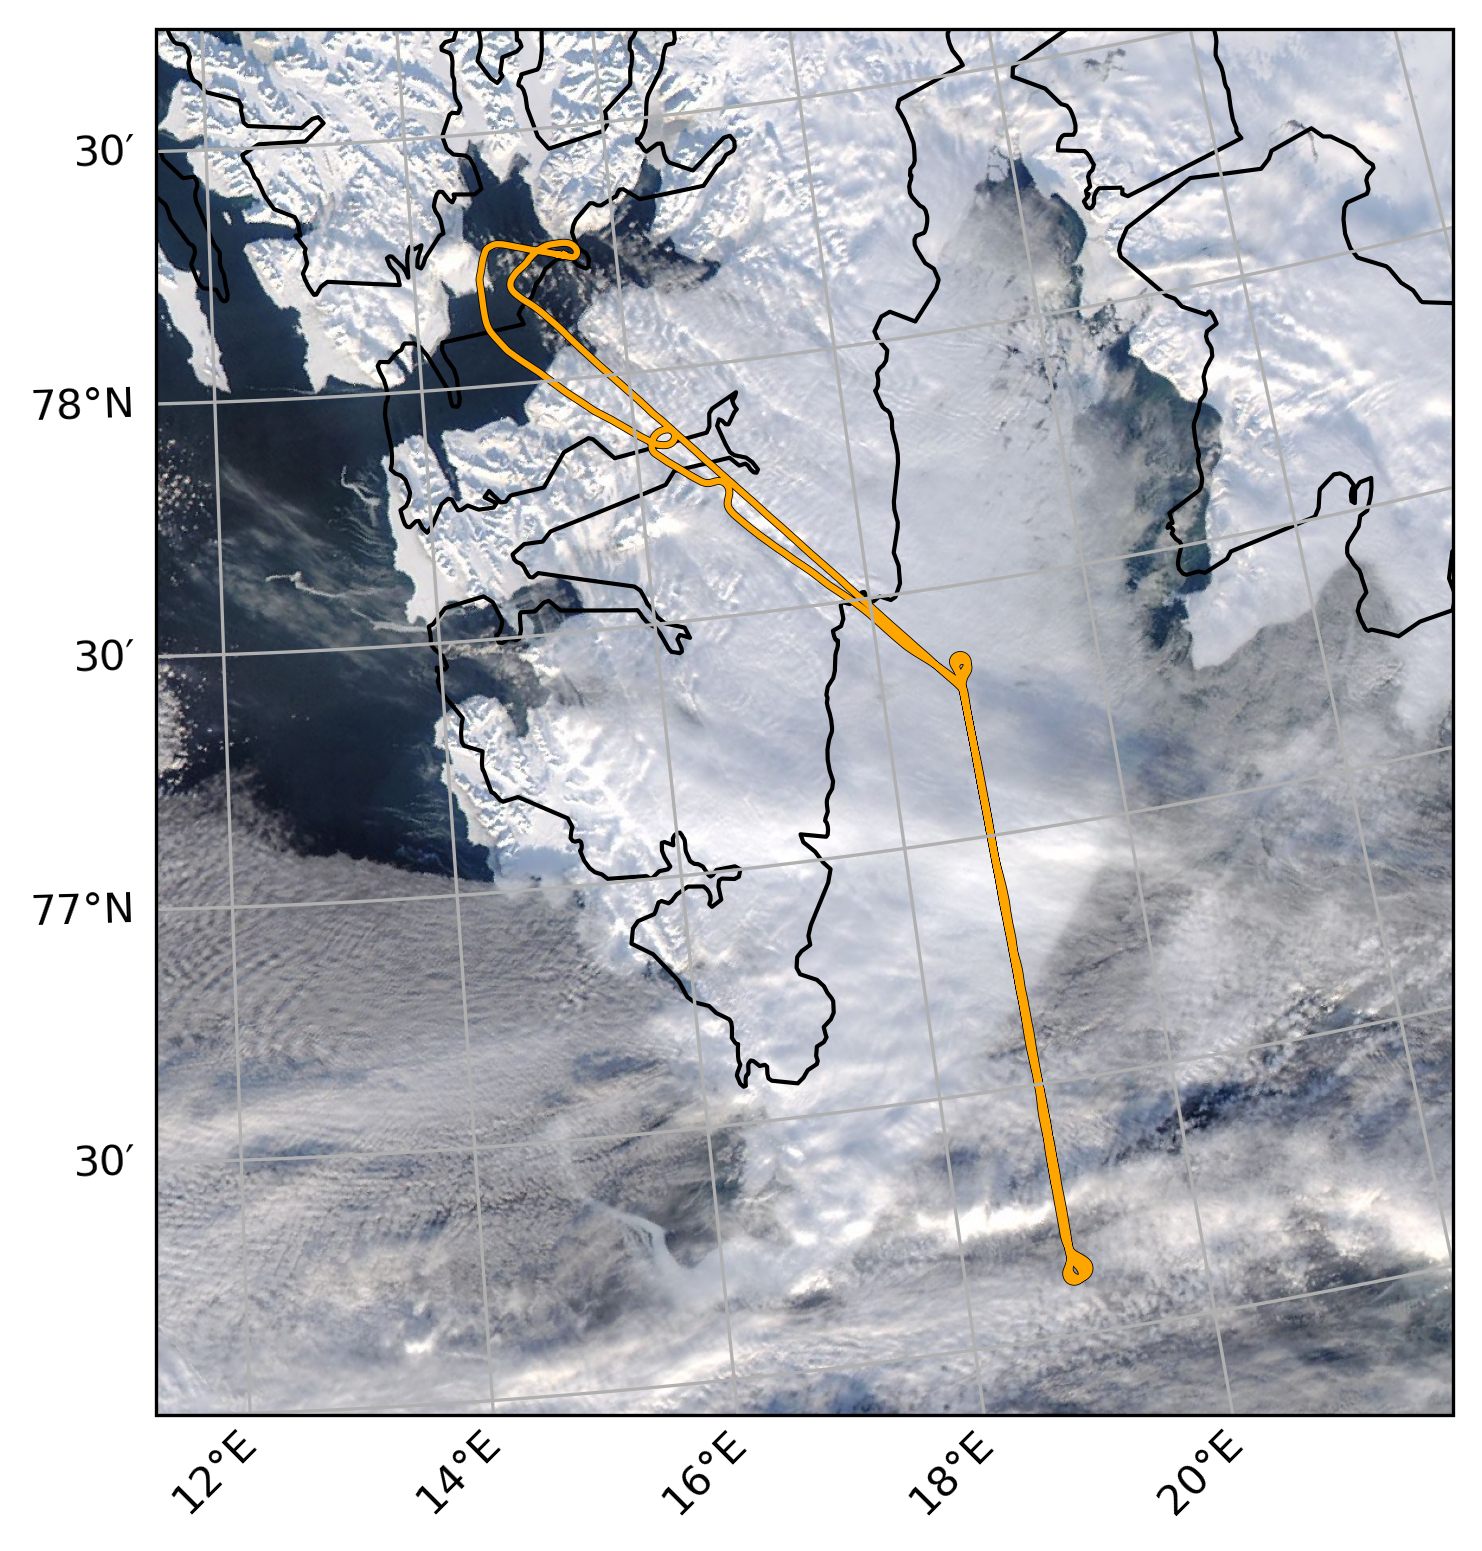
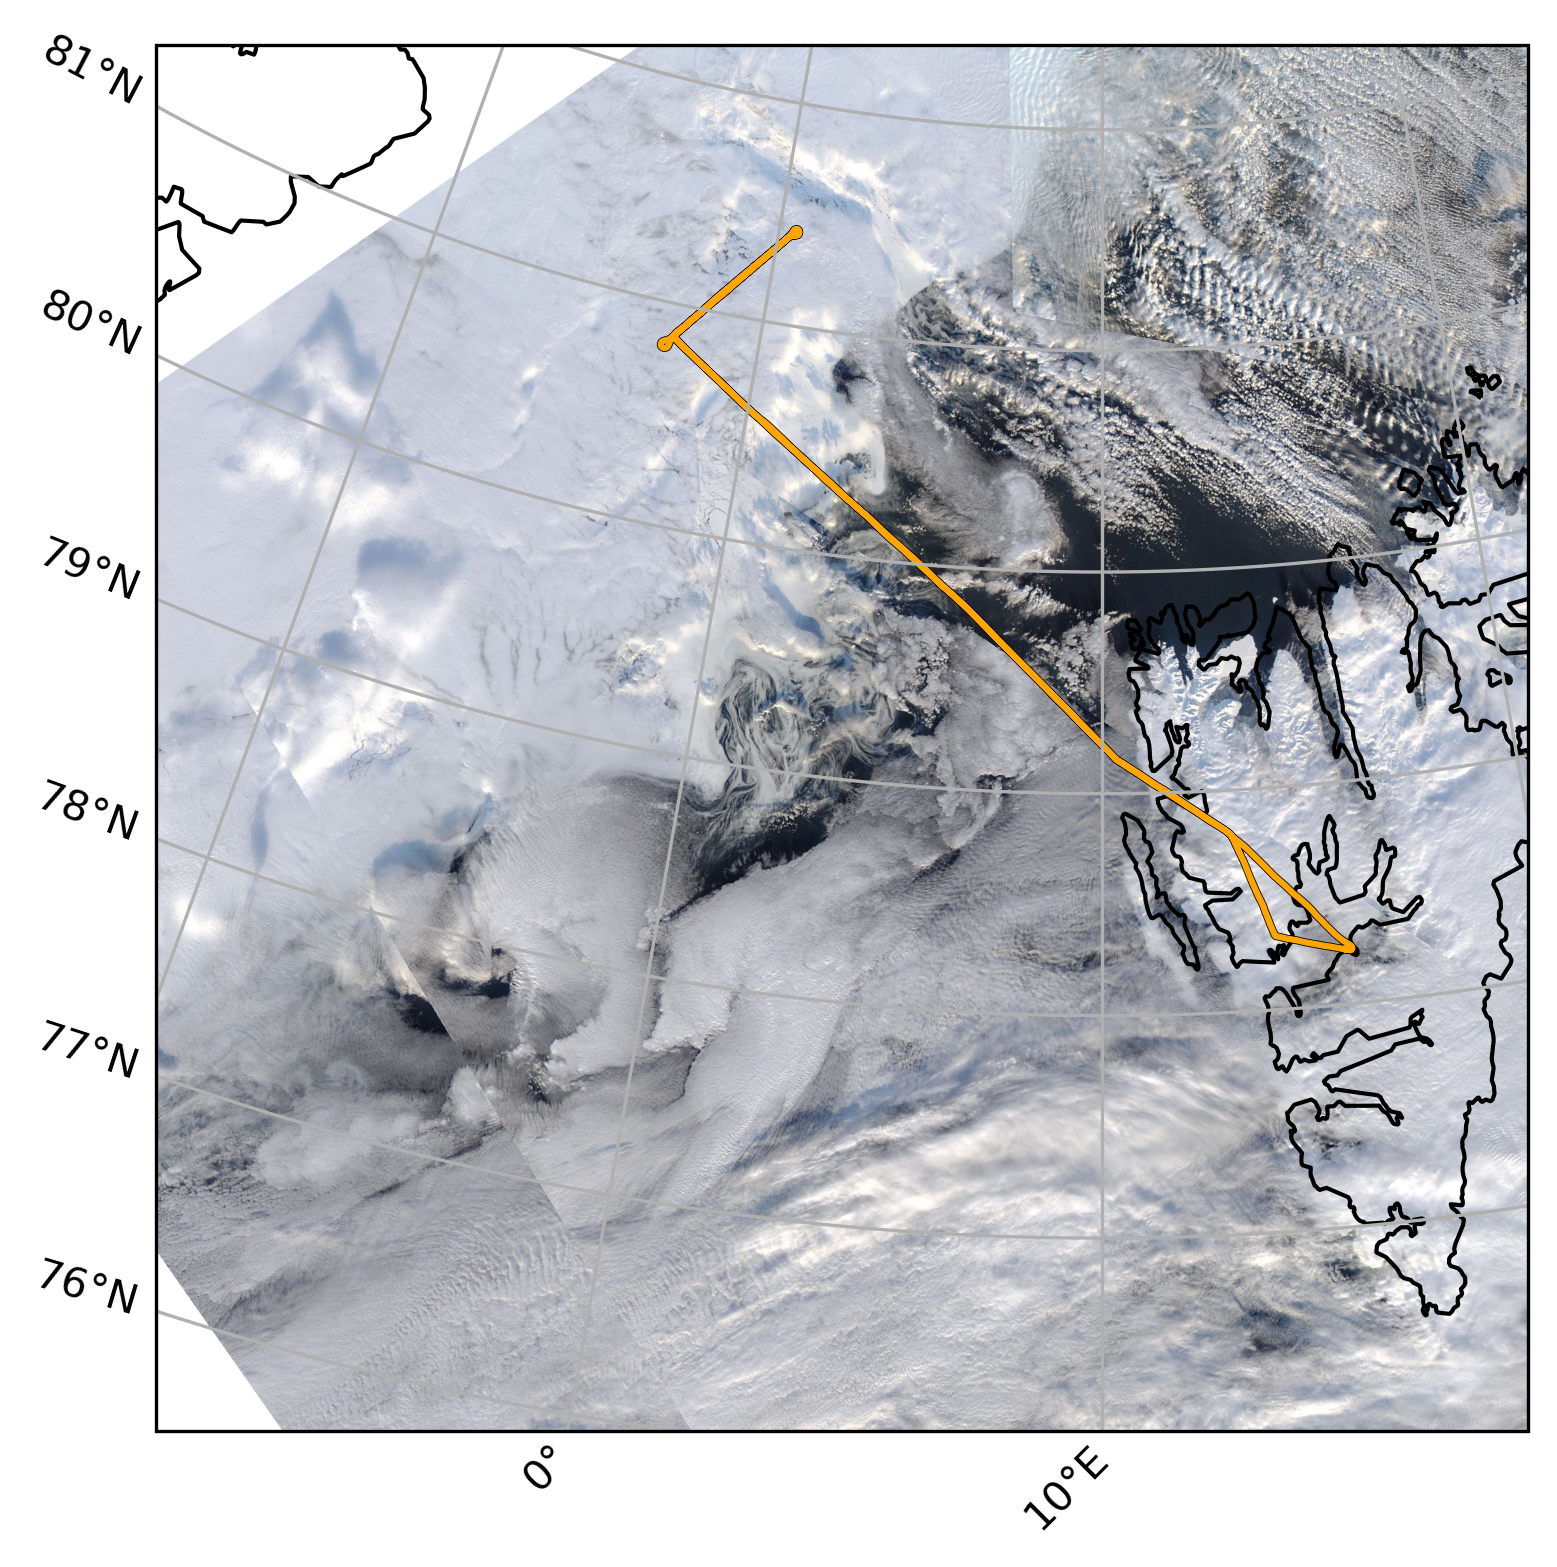
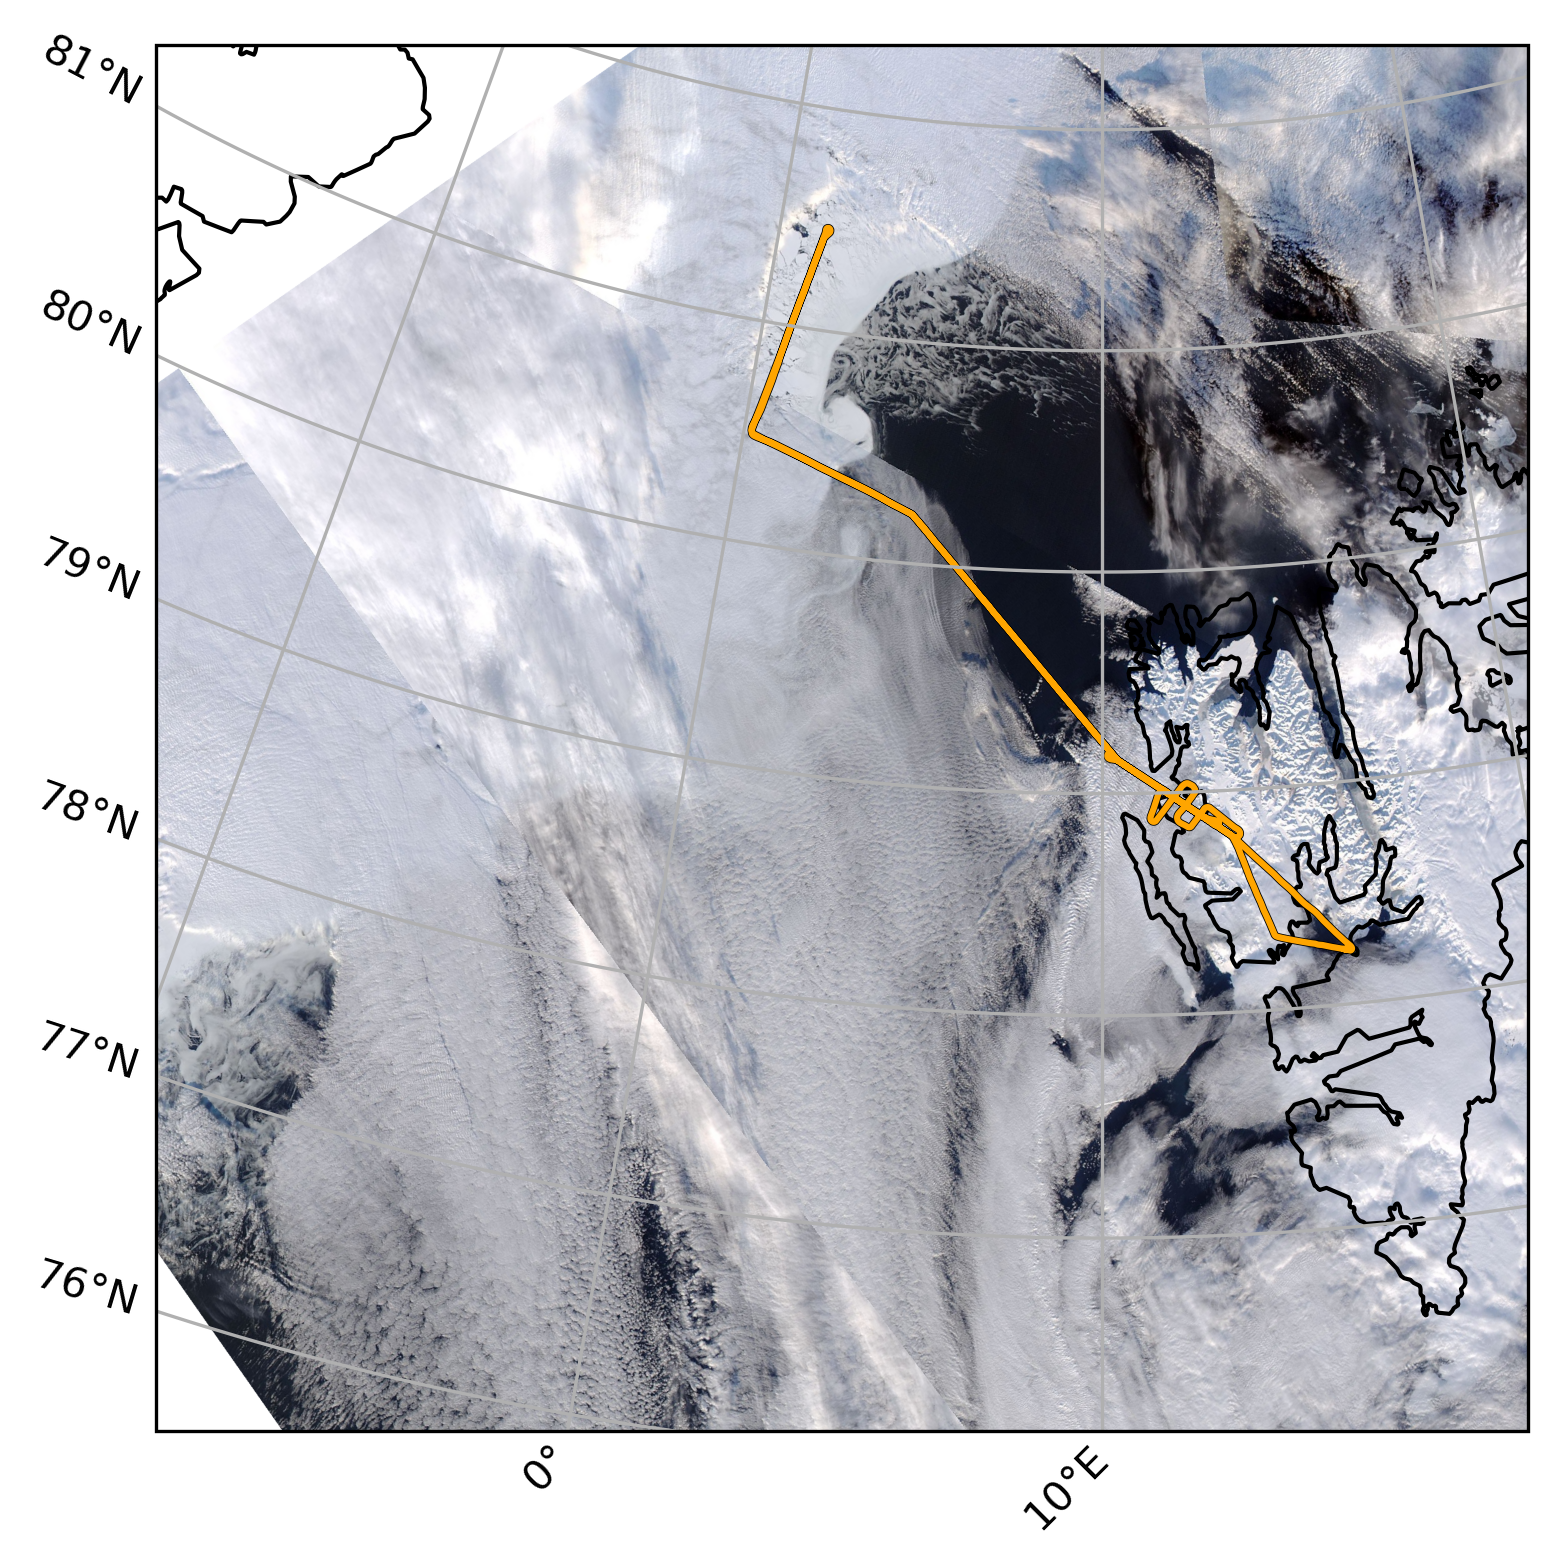
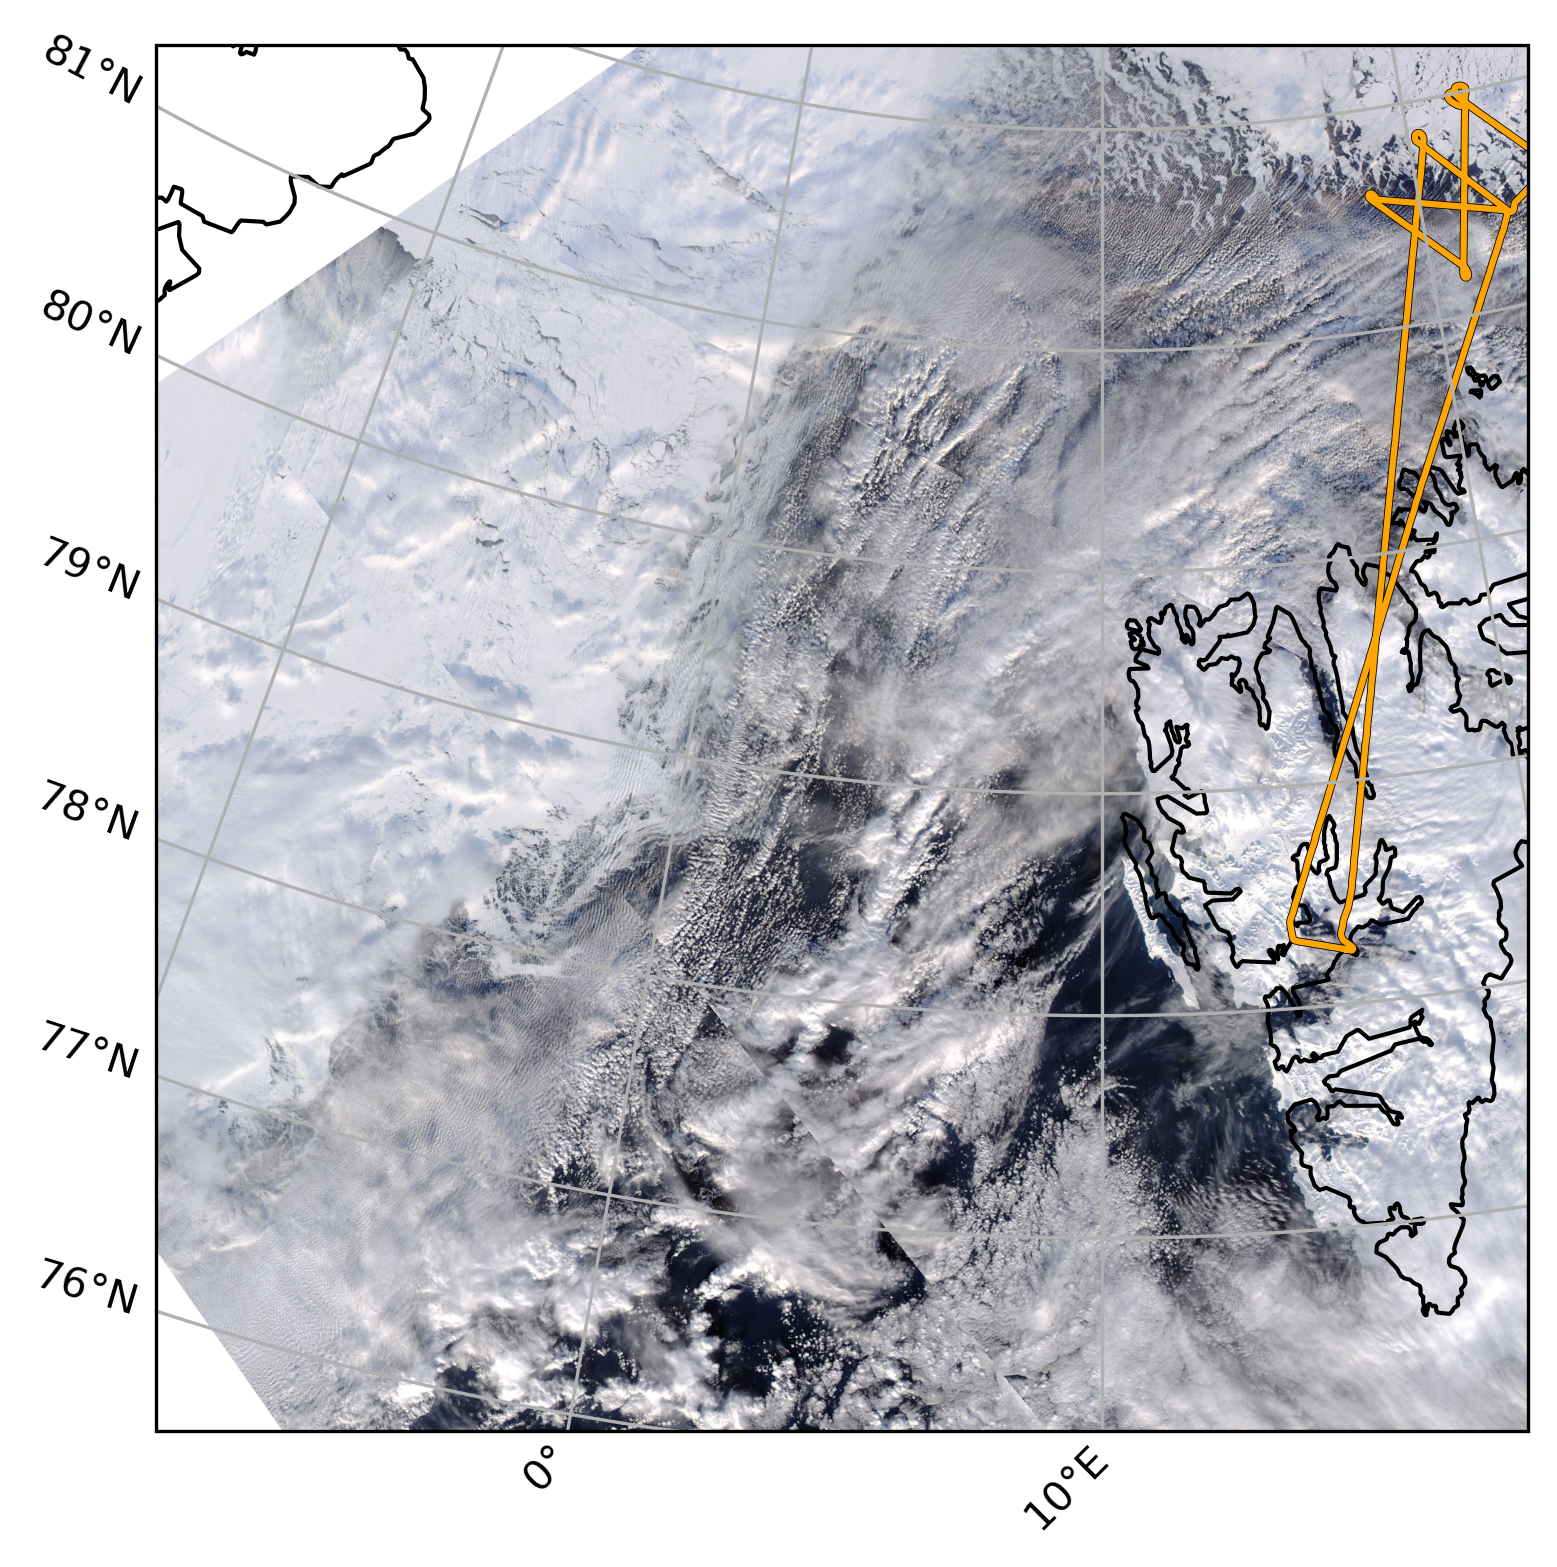
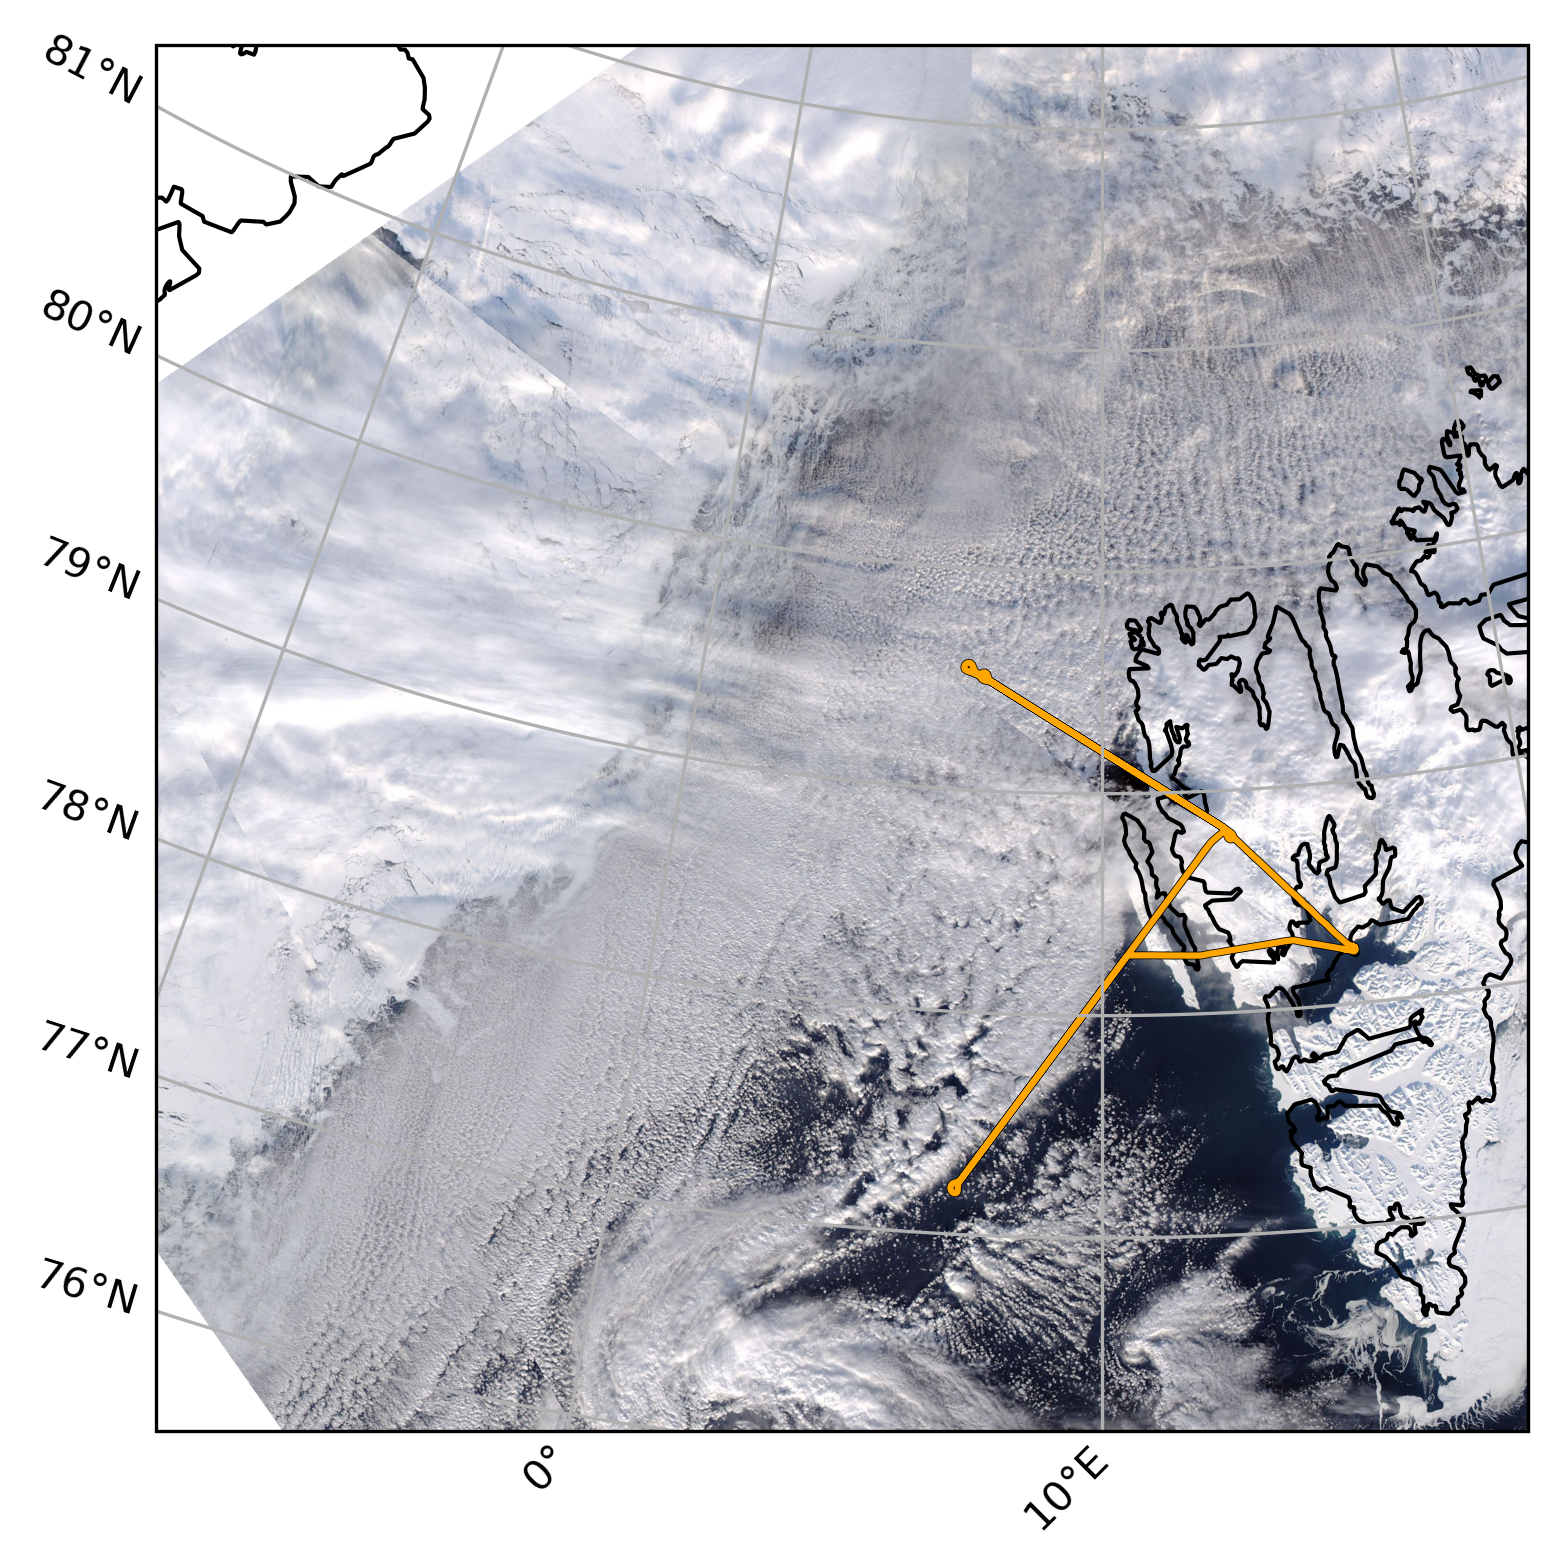
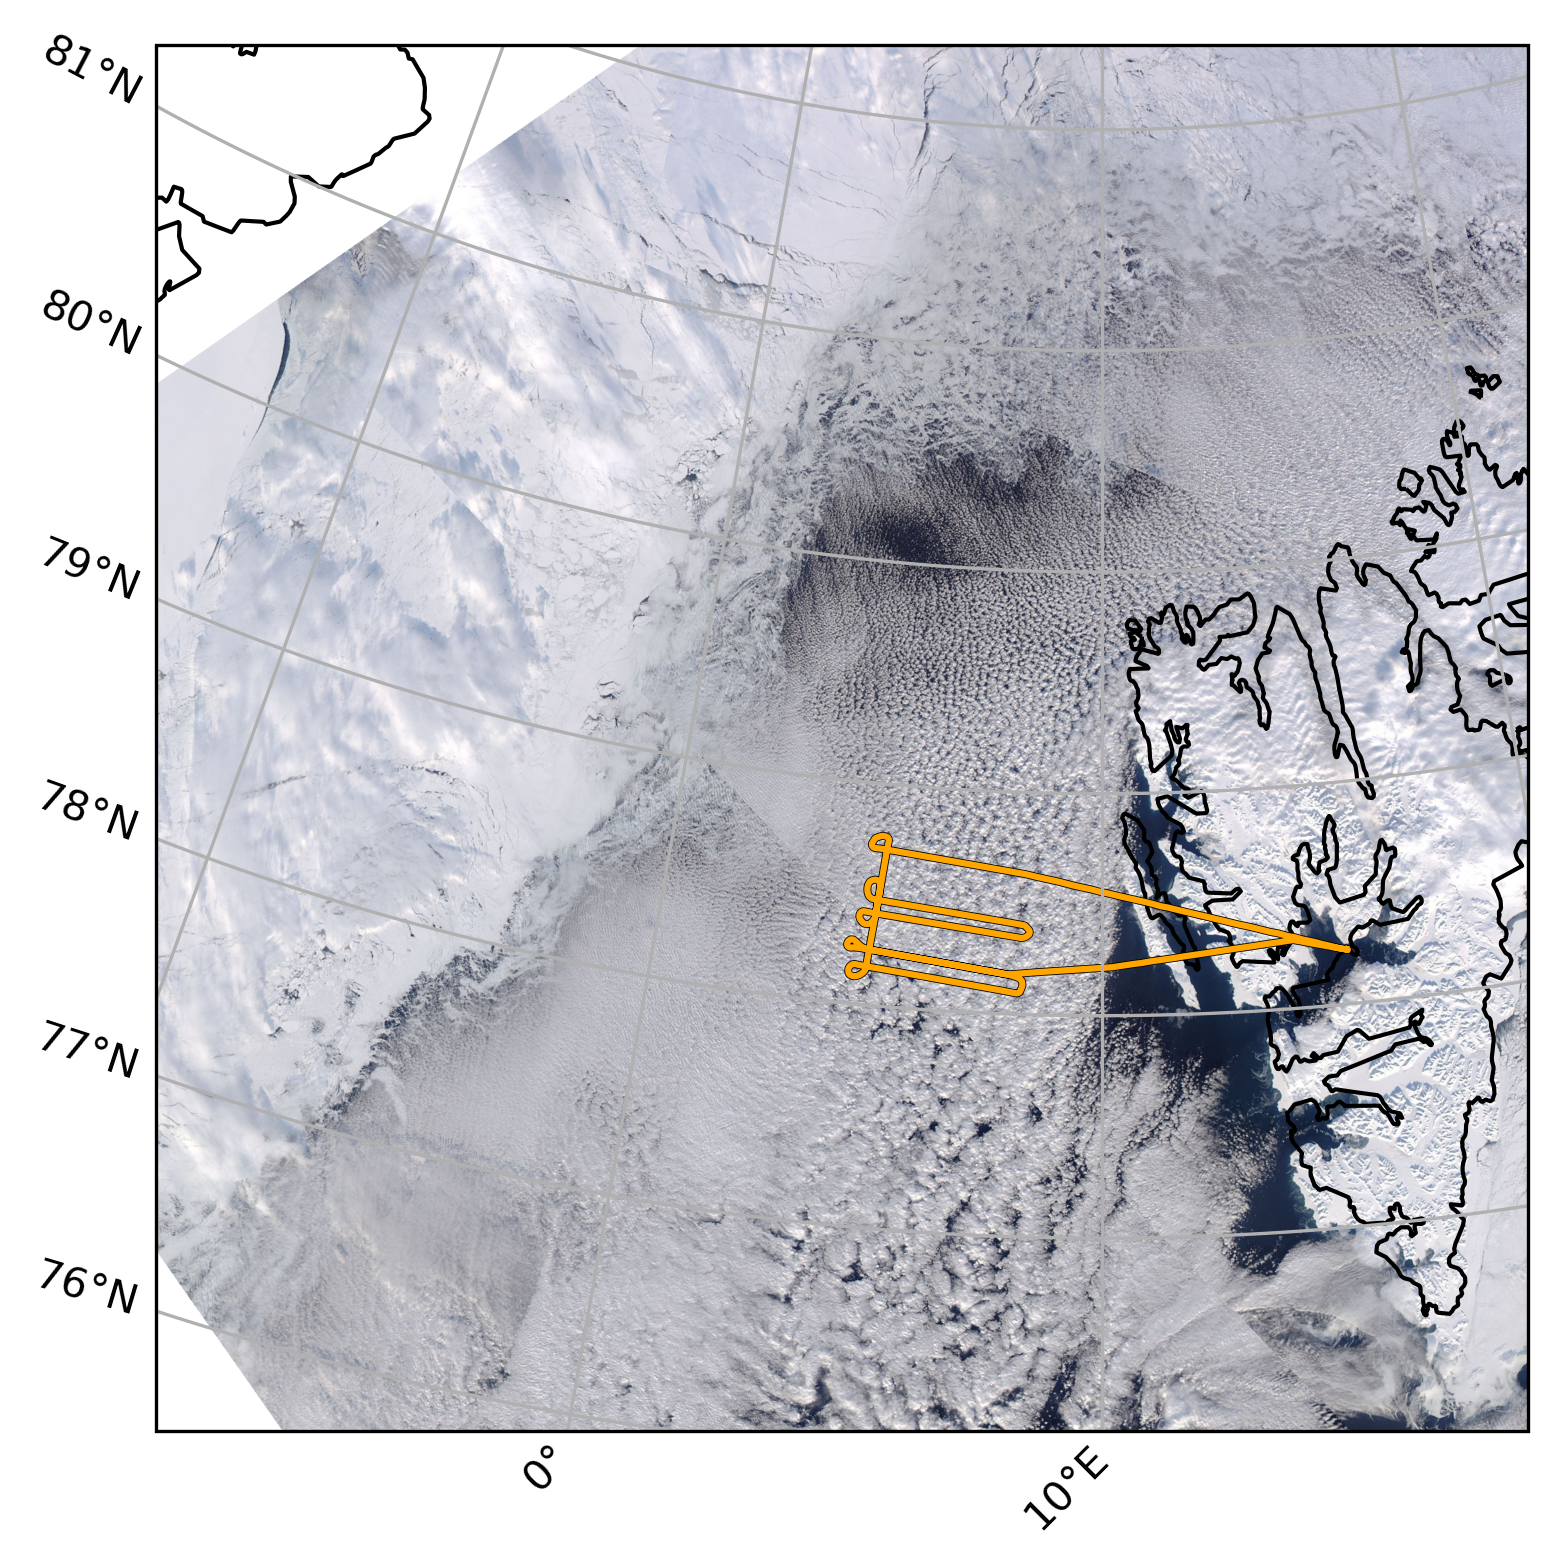
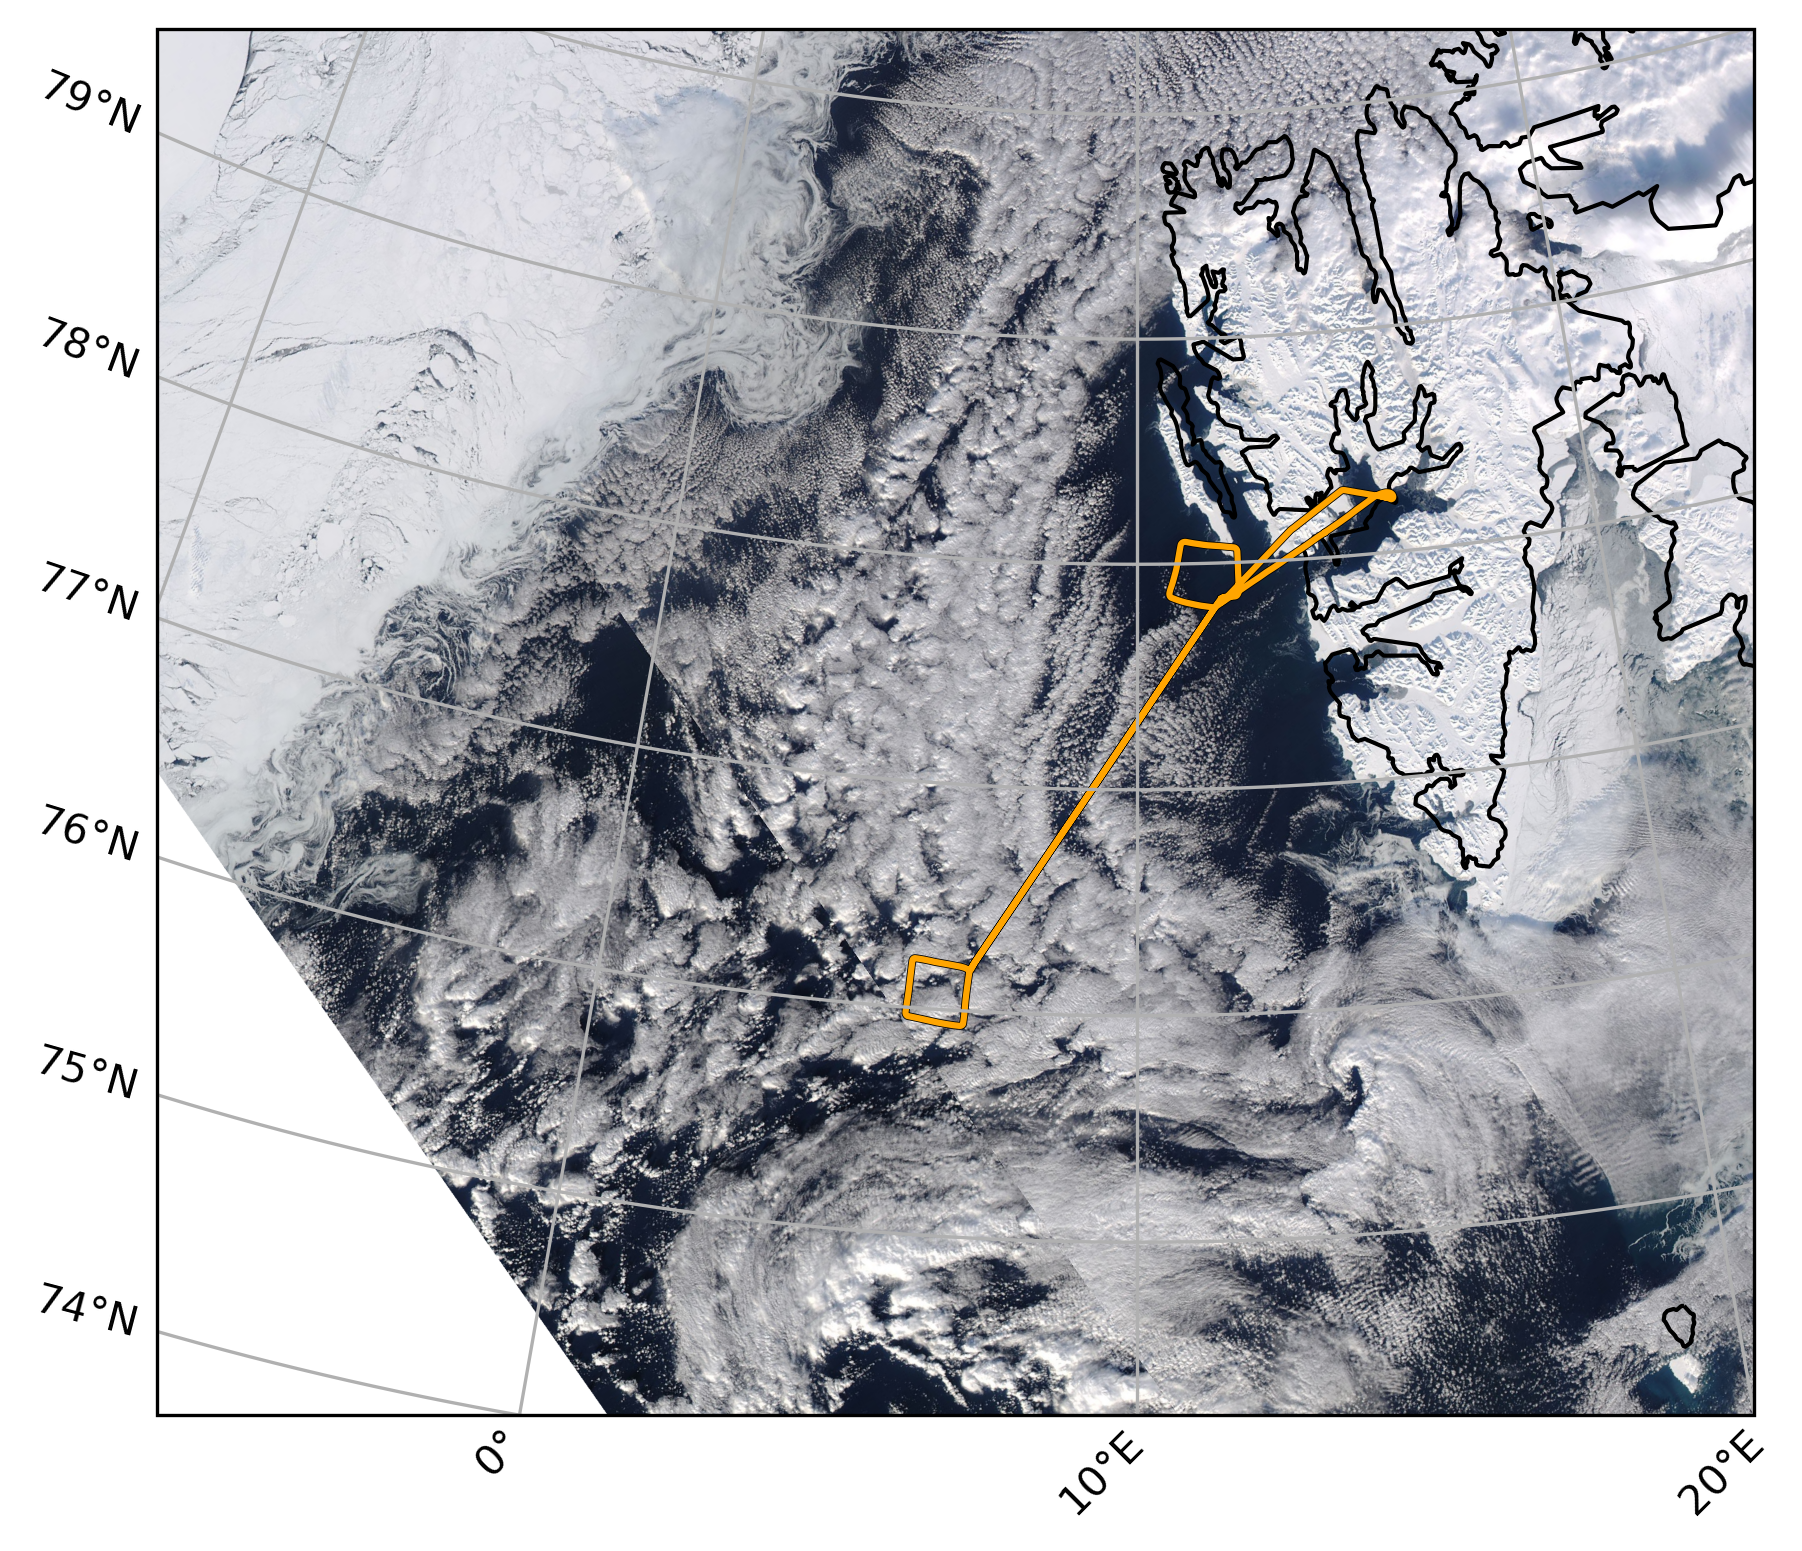
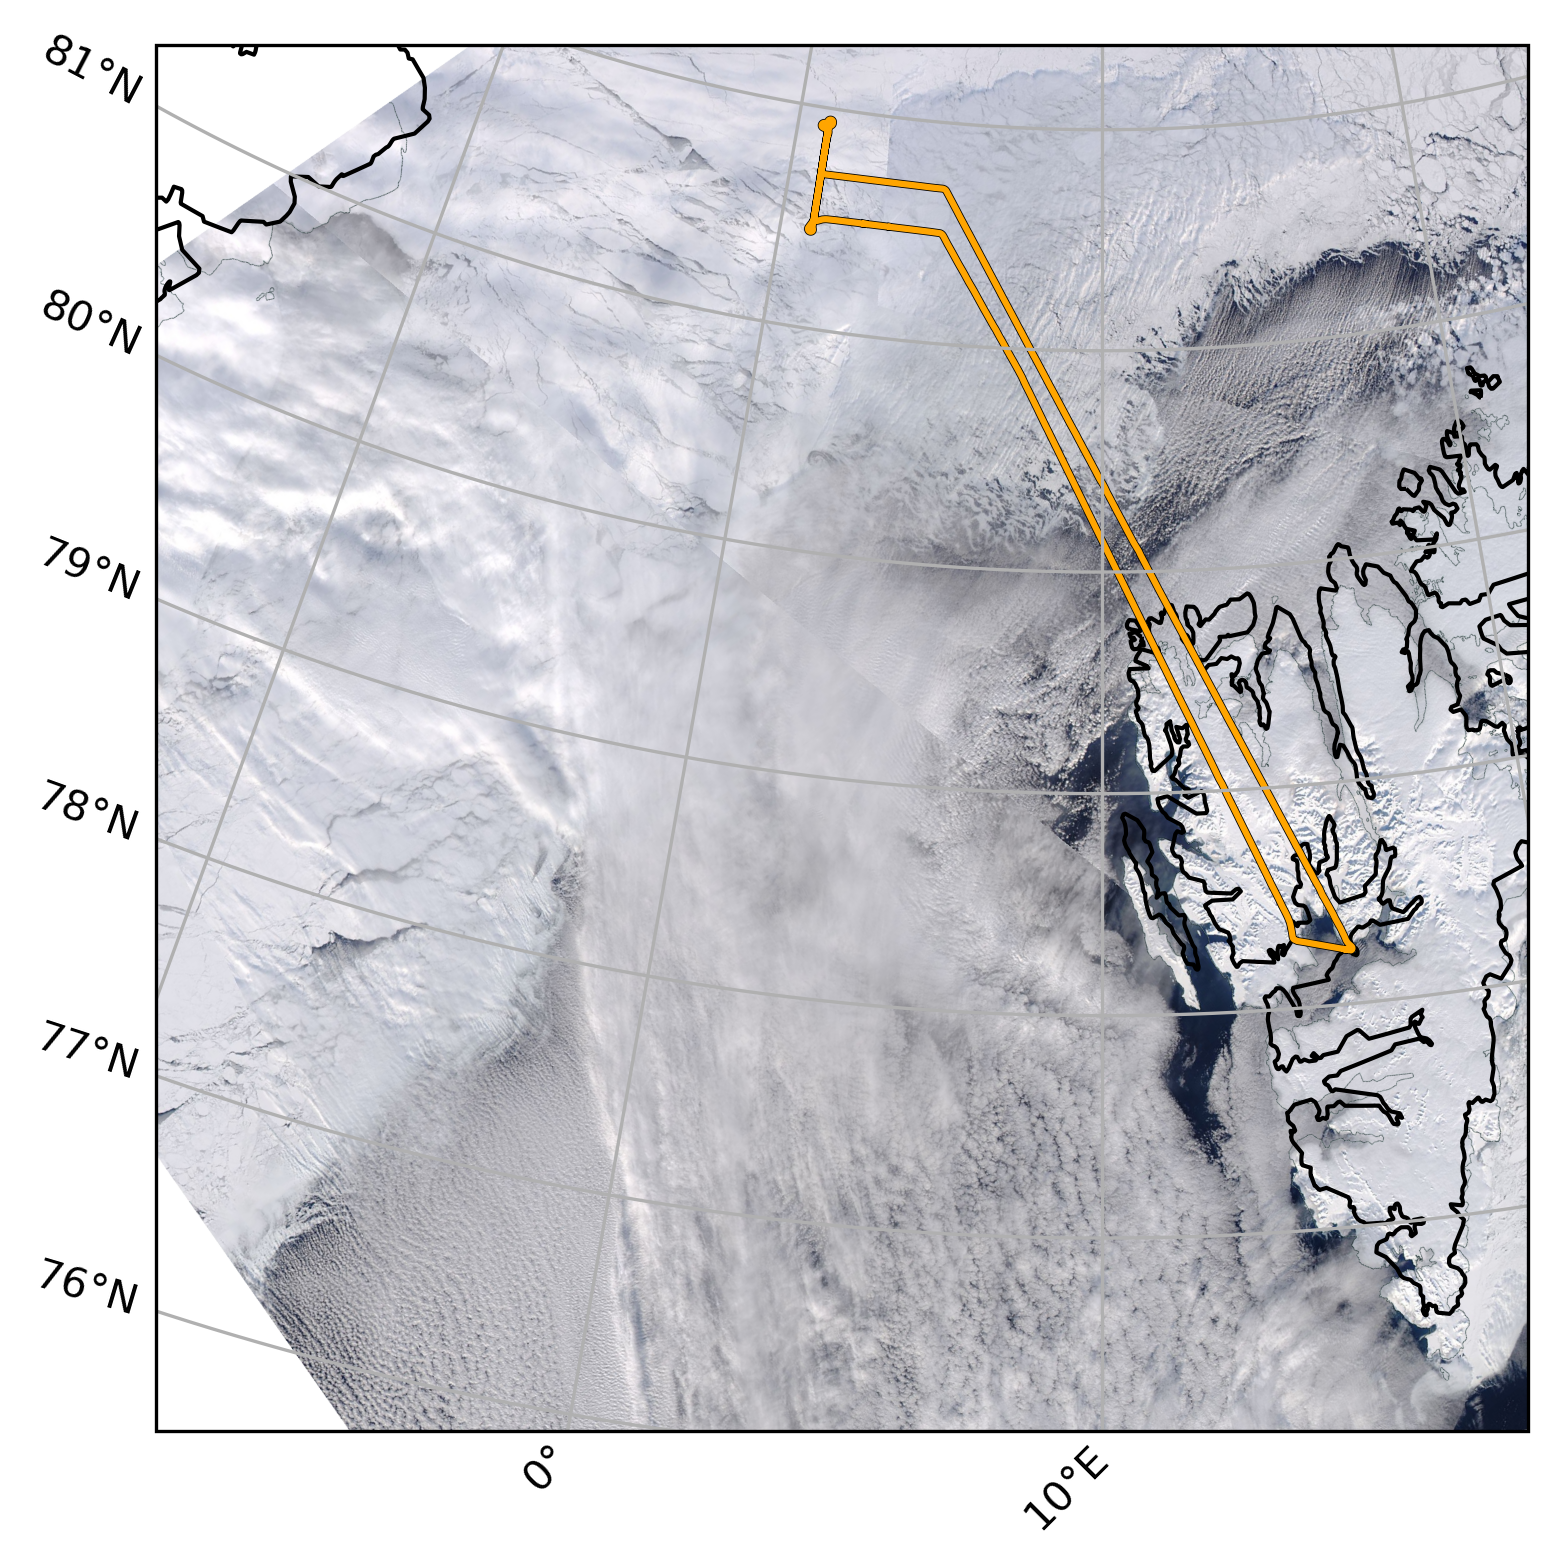
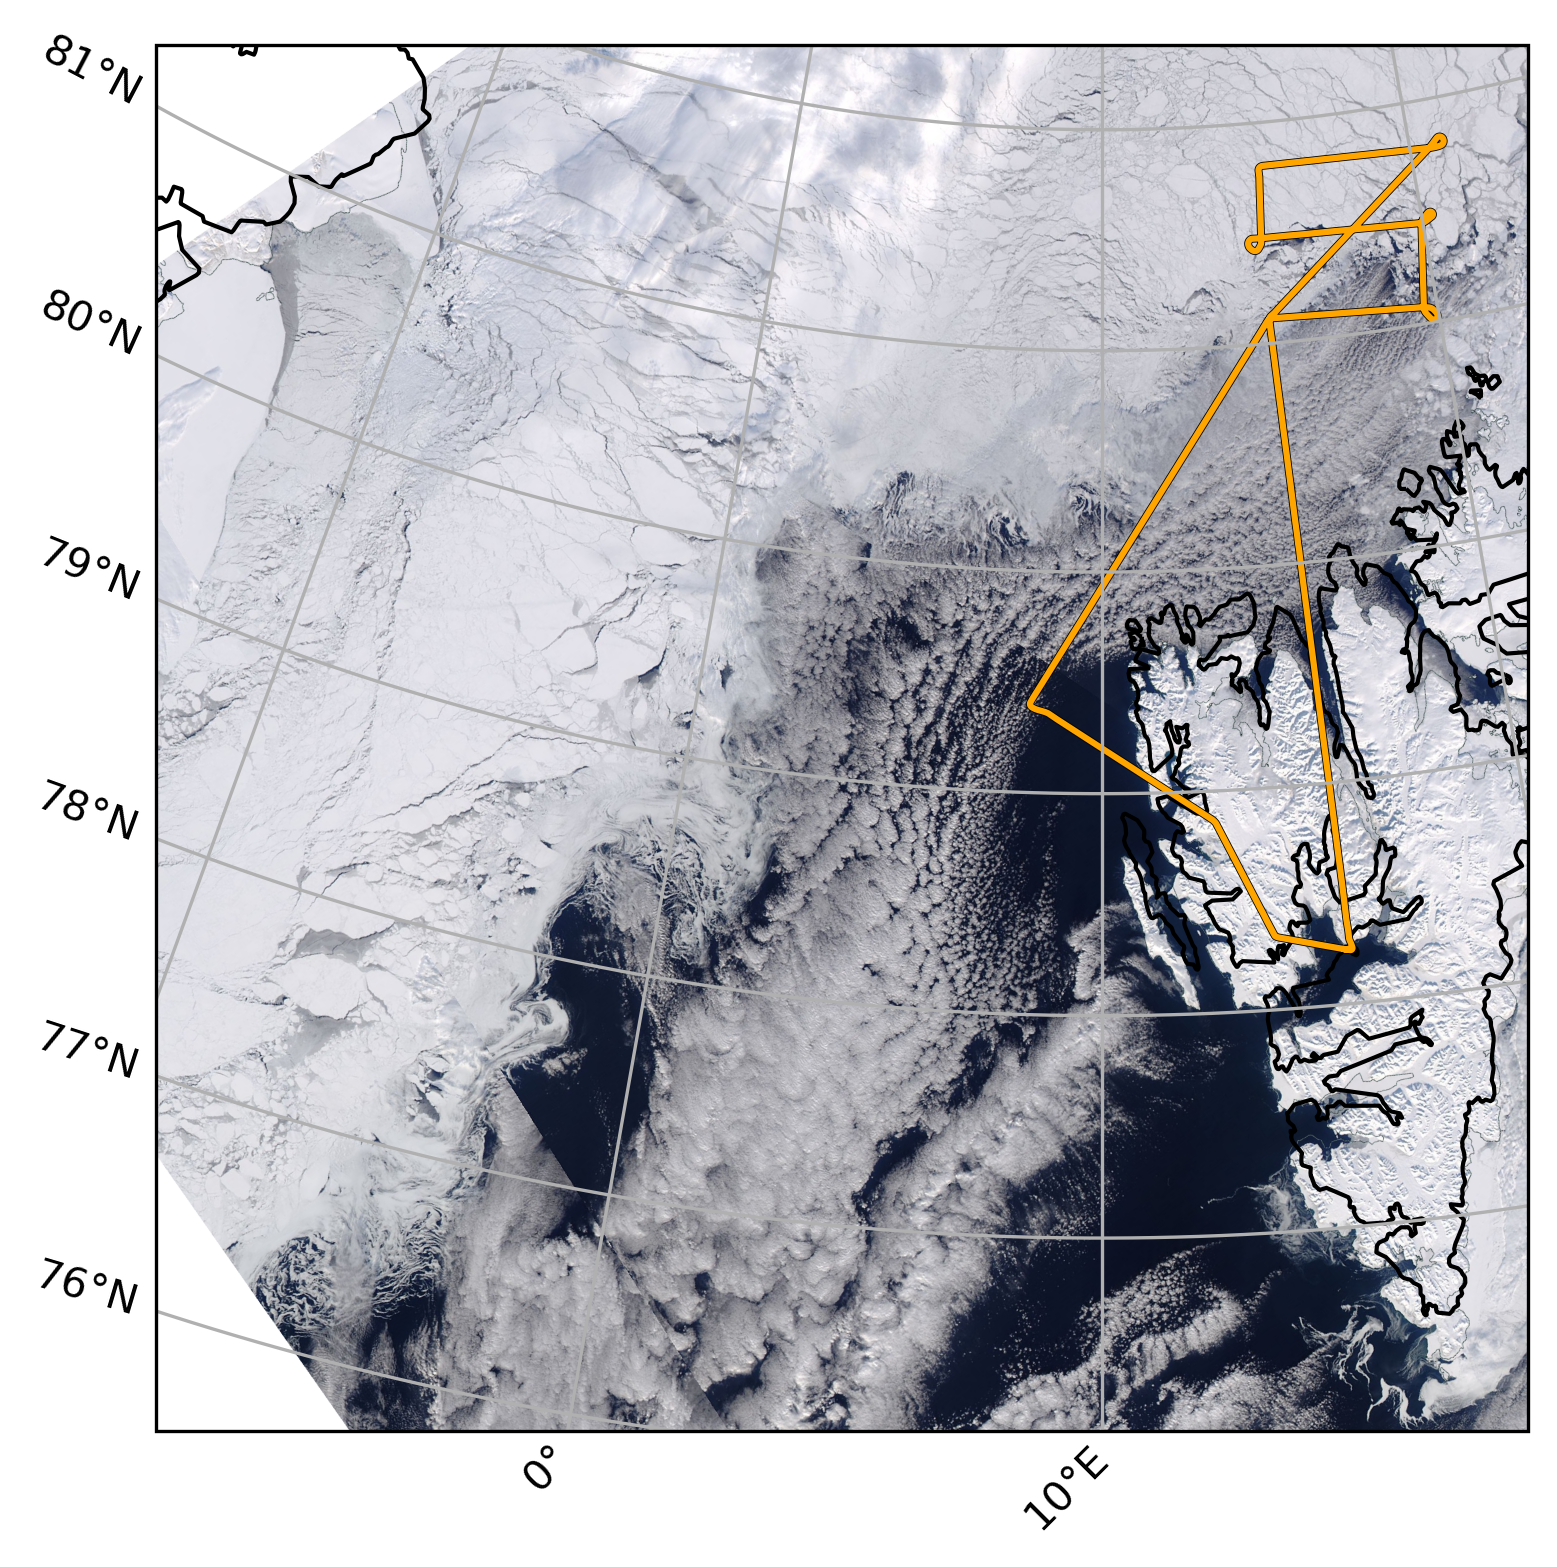
Fig. 4 Flight tracks of the COMPEX campaign.#
%matplotlib inline
import ac3airborne
import matplotlib.pyplot as plt
import matplotlib.patches as mpatches
import numpy as np
plt.style.use("../mplstyle/book")

# load intake catalog and flight segments
cat = ac3airborne.get_intake_catalog()
meta = ac3airborne.get_flight_segments()

ancillary = ['AMSR2_SIC']

def data_availability(mission, platform):
    """
    Plot data availability matrix
    """
    flights = list(filter(lambda d: meta[mission][platform][d]['mission'] == mission,  meta[mission][platform]))
    flights_dict = dict(filter(lambda d: mission == meta[mission][platform][d[0]]['mission'],  meta[mission][platform].items()))
    # store data availability in a matrix
    # data_availability = np.zeros(shape=(len(list(cat[mission][platform])),
    #                                     len(list(meta[mission][platform]))))
    data_availability = np.zeros(shape=(len(list(cat[mission][platform])),
                                        len(flights)))
    for i, dataset in enumerate(list(cat[mission][platform])):
        # data_availability[i, :] = np.isin(list(meta[mission][platform]),
        #                                   list(cat[mission][platform][dataset]))
        data_availability[i, :] = np.isin(flights,
                                          list(cat[mission][platform][dataset]))

    # plot data availability
    yscale = data_availability.shape[1]
    fig, ax = plt.subplots(1, 1, figsize=(5, 2+0.4*yscale))

    ax.pcolormesh(range(data_availability.shape[0]),
                  range(data_availability.shape[1]),
                  data_availability.T,
                  shading='nearest',
                  vmin=0,
                  vmax=1,
                  cmap='RdYlGn',
                  edgecolors='#eeeeee')

    ax.set_xticks(range(data_availability.shape[0]))
    ax.set_yticks(range(data_availability.shape[1]))

    xlabels = []
    for ds_name in list(cat[mission][platform]):
        if ds_name in ancillary:
            ds_name += '\n(ancillary)'
        xlabels.append(ds_name)

    ax.set_xticklabels(xlabels, rotation=90)
    # y_labels = [flight_id+', '+flight['date'].strftime('%Y-%m-%d')
    #             for flight_id, flight in meta[mission][platform].items()]
    y_labels = [flight_id+', '+flight['date'].strftime('%Y-%m-%d')
                for flight_id, flight in flights_dict.items()]
    ax.set_yticklabels(y_labels)

    ax.tick_params(labeltop=True)
    ax.invert_yaxis()

    available = mpatches.Patch(color='green', label='Data available')
    not_flown = mpatches.Patch(color='red', label='Data missing or\ninstrument failed')

    ax.legend(handles=[available, not_flown], ncol=1,
              bbox_to_anchor=(0, 1.01), loc='lower right')

    plt.show()
Polar 5#
data_availability(mission='COMPEX', platform='P5')
---------------------------------------------------------------------------
ScannerError                              Traceback (most recent call last)
Cell In[2], line 1
----> 1 data_availability(mission='COMPEX', platform='P5')

Cell In[1], line 29, in data_availability(mission, platform)
     23 data_availability = np.zeros(shape=(len(list(cat[mission][platform])),
     24                                     len(flights)))
     25 for i, dataset in enumerate(list(cat[mission][platform])):
     26     # data_availability[i, :] = np.isin(list(meta[mission][platform]),
     27     #                                   list(cat[mission][platform][dataset]))
     28     data_availability[i, :] = np.isin(flights,
---> 29                                       list(cat[mission][platform][dataset]))
     31 # plot data availability
     32 yscale = data_availability.shape[1]

File /net/sever/mech/miniconda3/envs/howtoac3/lib/python3.11/site-packages/intake/catalog/base.py:309, in Catalog.__iter__(self)
    307 def __iter__(self):
    308     """Return an iterator over catalog entry names."""
--> 309     return iter(self._get_entries())

File /net/sever/mech/miniconda3/envs/howtoac3/lib/python3.11/site-packages/intake/catalog/utils.py:42, in reload_on_change.<locals>.wrapper(self, *args, **kwargs)
     40 @functools.wraps(f)
     41 def wrapper(self, *args, **kwargs):
---> 42     self.reload()
     43     return f(self, *args, **kwargs)

File /net/sever/mech/miniconda3/envs/howtoac3/lib/python3.11/site-packages/intake/catalog/base.py:163, in Catalog.reload(self)
    161 """Reload catalog if sufficient time has passed"""
    162 if time.time() - self.updated > self.ttl:
--> 163     self.force_reload()

File /net/sever/mech/miniconda3/envs/howtoac3/lib/python3.11/site-packages/intake/catalog/base.py:158, in Catalog.force_reload(self)
    156 """Imperative reload data now"""
    157 self.updated = time.time()
--> 158 self._load()

File /net/sever/mech/miniconda3/envs/howtoac3/lib/python3.11/site-packages/intake/catalog/local.py:603, in YAMLFileCatalog._load(self, reload)
    601     logger.warning("Use of '!template' deprecated - fixing")
    602     text = text.replace('!template ', '')
--> 603 self.parse(text)

File /net/sever/mech/miniconda3/envs/howtoac3/lib/python3.11/site-packages/intake/catalog/local.py:672, in YAMLFileCatalog.parse(self, text)
    660 """Create entries from catalog text
    661
    662 Normally the text comes from the file at self.path via the ``_load()``
   (...)    669     YAML formatted catalog spec
    670 """
    671 self.text = text
--> 672 data = yaml_load(self.text)
    674 if data is None:
    675     raise exceptions.CatalogException('No YAML data in file')

File /net/sever/mech/miniconda3/envs/howtoac3/lib/python3.11/site-packages/intake/utils.py:78, in yaml_load(stream)
     76 """Parse YAML in a context where duplicate keys raise exception"""
     77 with no_duplicate_yaml():
---> 78     return yaml.safe_load(stream)

File /net/sever/mech/miniconda3/envs/howtoac3/lib/python3.11/site-packages/yaml/__init__.py:125, in safe_load(stream)
    117 def safe_load(stream):
    118     """
    119     Parse the first YAML document in a stream
    120     and produce the corresponding Python object.
   (...)    123     to be safe for untrusted input.
    124     """
--> 125     return load(stream, SafeLoader)

File /net/sever/mech/miniconda3/envs/howtoac3/lib/python3.11/site-packages/yaml/__init__.py:81, in load(stream, Loader)
     79 loader = Loader(stream)
     80 try:
---> 81     return loader.get_single_data()
     82 finally:
     83     loader.dispose()

File /net/sever/mech/miniconda3/envs/howtoac3/lib/python3.11/site-packages/yaml/constructor.py:49, in BaseConstructor.get_single_data(self)
     47 def get_single_data(self):
     48     # Ensure that the stream contains a single document and construct it.
---> 49     node = self.get_single_node()
     50     if node is not None:
     51         return self.construct_document(node)

File /net/sever/mech/miniconda3/envs/howtoac3/lib/python3.11/site-packages/yaml/composer.py:36, in Composer.get_single_node(self)
     34 document = None
     35 if not self.check_event(StreamEndEvent):
---> 36     document = self.compose_document()
     38 # Ensure that the stream contains no more documents.
     39 if not self.check_event(StreamEndEvent):

File /net/sever/mech/miniconda3/envs/howtoac3/lib/python3.11/site-packages/yaml/composer.py:55, in Composer.compose_document(self)
     52 self.get_event()
     54 # Compose the root node.
---> 55 node = self.compose_node(None, None)
     57 # Drop the DOCUMENT-END event.
     58 self.get_event()

File /net/sever/mech/miniconda3/envs/howtoac3/lib/python3.11/site-packages/yaml/composer.py:84, in Composer.compose_node(self, parent, index)
     82     node = self.compose_sequence_node(anchor)
     83 elif self.check_event(MappingStartEvent):
---> 84     node = self.compose_mapping_node(anchor)
     85 self.ascend_resolver()
     86 return node

File /net/sever/mech/miniconda3/envs/howtoac3/lib/python3.11/site-packages/yaml/composer.py:133, in Composer.compose_mapping_node(self, anchor)
    129 item_key = self.compose_node(node, None)
    130 #if item_key in node.value:
    131 #    raise ComposerError("while composing a mapping", start_event.start_mark,
    132 #            "found duplicate key", key_event.start_mark)
--> 133 item_value = self.compose_node(node, item_key)
    134 #node.value[item_key] = item_value
    135 node.value.append((item_key, item_value))

File /net/sever/mech/miniconda3/envs/howtoac3/lib/python3.11/site-packages/yaml/composer.py:84, in Composer.compose_node(self, parent, index)
     82     node = self.compose_sequence_node(anchor)
     83 elif self.check_event(MappingStartEvent):
---> 84     node = self.compose_mapping_node(anchor)
     85 self.ascend_resolver()
     86 return node

File /net/sever/mech/miniconda3/envs/howtoac3/lib/python3.11/site-packages/yaml/composer.py:127, in Composer.compose_mapping_node(self, anchor)
    125 if anchor is not None:
    126     self.anchors[anchor] = node
--> 127 while not self.check_event(MappingEndEvent):
    128     #key_event = self.peek_event()
    129     item_key = self.compose_node(node, None)
    130     #if item_key in node.value:
    131     #    raise ComposerError("while composing a mapping", start_event.start_mark,
    132     #            "found duplicate key", key_event.start_mark)

File /net/sever/mech/miniconda3/envs/howtoac3/lib/python3.11/site-packages/yaml/parser.py:98, in Parser.check_event(self, *choices)
     96 if self.current_event is None:
     97     if self.state:
---> 98         self.current_event = self.state()
     99 if self.current_event is not None:
    100     if not choices:

File /net/sever/mech/miniconda3/envs/howtoac3/lib/python3.11/site-packages/yaml/parser.py:428, in Parser.parse_block_mapping_key(self)
    427 def parse_block_mapping_key(self):
--> 428     if self.check_token(KeyToken):
    429         token = self.get_token()
    430         if not self.check_token(KeyToken, ValueToken, BlockEndToken):

File /net/sever/mech/miniconda3/envs/howtoac3/lib/python3.11/site-packages/yaml/scanner.py:116, in Scanner.check_token(self, *choices)
    113 def check_token(self, *choices):
    114     # Check if the next token is one of the given types.
    115     while self.need_more_tokens():
--> 116         self.fetch_more_tokens()
    117     if self.tokens:
    118         if not choices:

File /net/sever/mech/miniconda3/envs/howtoac3/lib/python3.11/site-packages/yaml/scanner.py:223, in Scanner.fetch_more_tokens(self)
    221 # Is it the value indicator?
    222 if ch == ':' and self.check_value():
--> 223     return self.fetch_value()
    225 # Is it an alias?
    226 if ch == '*':

File /net/sever/mech/miniconda3/envs/howtoac3/lib/python3.11/site-packages/yaml/scanner.py:577, in Scanner.fetch_value(self)
    572 if not self.flow_level:
    573
    574     # We are allowed to start a complex value if and only if
    575     # we can start a simple key.
    576     if not self.allow_simple_key:
--> 577         raise ScannerError(None, None,
    578                 "mapping values are not allowed here",
    579                 self.get_mark())
    581 # If this value starts a new block mapping, we need to add
    582 # BLOCK-MAPPING-START.  It will be detected as an error later by
    583 # the parser.
    584 if not self.flow_level:

ScannerError: mapping values are not allowed here
  in "<unicode string>", line 15, column 8:
       args:
           ^